Day 2: Alertmanager
Goal: An Alertmanager accepts the alerts from Prometheus and sends notifications to a webhook. With
amtoolyou view alerts, check the configuration and trigger test alerts. · Duration: approx. 50 min · Prerequisite: Day 1
Briefing
- Prometheus resends every firing alert to Alertmanager about once per minute. Alertmanager decides whether, when and where it becomes a notification.
- It groups alerts (
group_by) so that ten broken pods result in one message and not ten. It routes them to receivers (mail, chat, webhook) and finally sends a resolved message. - It also handles muting (silences) and suppressing (inhibition). That comes on Day 5.
- In the lab, the receiver is alarm-log: a small webhook receiver from the companion code that writes every notification as one line to the log.
 Prometheus ── POST /api/v2/alerts ──► Alertmanager :9093 ── Webhook ──► alarm-log :5001
   (firing, resent every minute)       group · route · wait              one line per
                                                                         notification
Drill 1: amtool
amtool is to Alertmanager what promtool is
to Prometheus. It is included in the Alertmanager archive:
cd ~/am-lab
curl -fsSLO https://github.com/prometheus/alertmanager/releases/download/\
v0.35.0/alertmanager-0.35.0.linux-amd64.tar.gz
tar xzf alertmanager-0.35.0.linux-amd64.tar.gz
mv alertmanager-0.35.0.linux-amd64/amtool ~/.local/bin/
rm -r alertmanager-0.35.0.linux-amd64*
amtool --version 2>&1 | head -1
Expected:
amtool, version 0.35.0 (branch: HEAD, revision: 8cf67a8e75004bad6c3c6bacc829945cf8a3ee65)So that you do not have to pass --alertmanager.url on
every call:
mkdir -p ~/.config/amtool
cat > ~/.config/amtool/config.yml <<'EOF'
alertmanager.url: http://localhost:9093
EOF
Save your progress? Sign up for free
Drill 2: The Receiver alarm-log
Take a look at the tool:
less code/alarm-log/alarm_log.py- 40 lines of Python without dependencies. Every
POSTis a notification from Alertmanager, and it becomes one line: time, path, receiver, status, group labels, alert names and how many of them are firing and resolved. GET /returns the last notification in full as JSON. That way you see what a real receiver such as a chat service would get.- It runs in the official Python image; the file is only mounted.
Save your progress? Sign up for free
Drill 3: The Configuration
The smallest useful configuration: one route, one receiver.
mkdir -p alertmanager
cat > alertmanager/alertmanager.yml <<'EOF'
route:
  receiver: alarm-log
  group_by: [alertname]

receivers:
  - name: alarm-log
    webhook_configs:
      - url: http://alarm-log:5001/
EOF
amtool check-config alertmanager/alertmanager.yml
Expected:
Checking 'alertmanager/alertmanager.yml'  SUCCESS
Found:
 - global config
 - route
 - 0 inhibit rules
 - 1 receivers
- 0 templatesrouteis the root of the routing tree. Every alert lands here first. Without child routes, everything goes toreceiver: alarm-log.group_by: [alertname]combines all alerts with the same name into one group. One group results in one notification.
Save your progress? Sign up for free
Drill 4: Start Alertmanager
cat > alerting.yaml <<'EOF'
services:
  alertmanager:
    image: prom/alertmanager:v0.35.0
    command:
      - --config.file=/etc/alertmanager/alertmanager.yml
      - --storage.path=/alertmanager
      - --web.external-url=http://${VM_IP}:9093
      - --cluster.listen-address=
    volumes:
      - ./alertmanager:/etc/alertmanager:ro
      - amdata:/alertmanager
    ports:
      - "9093:9093"

  alarm-log:
    image: python:3.14.10-alpine
    command: ["python", "-u", "/alarm_log.py"]
    volumes:
      - ./code/alarm-log/alarm_log.py:/alarm_log.py:ro
    ports:
      - "5001:5001"

volumes:
  amdata:
EOF
echo " - alerting.yaml" >> compose.yaml--storage.path: this is where Alertmanager stores silences and the notification log. Theamdatavolume makes sure both survive a restart.--cluster.listen-address=with an empty value switches off cluster mode. Without the flag, a single Alertmanager searches for peers. On Day 6 you switch it on deliberately.
Prometheus needs to know where to send alerts:
cat >> prometheus/prometheus.yml <<'EOF'

alerting:
  alertmanagers:
    - static_configs:
        - targets: ["alertmanager:9093"]
EOF
docker compose up -d
curl -s -X POST localhost:9090/-/reload
curl -s localhost:9090/api/v1/alertmanagers | jq -c '.data.activeAlertmanagers'
Expected:
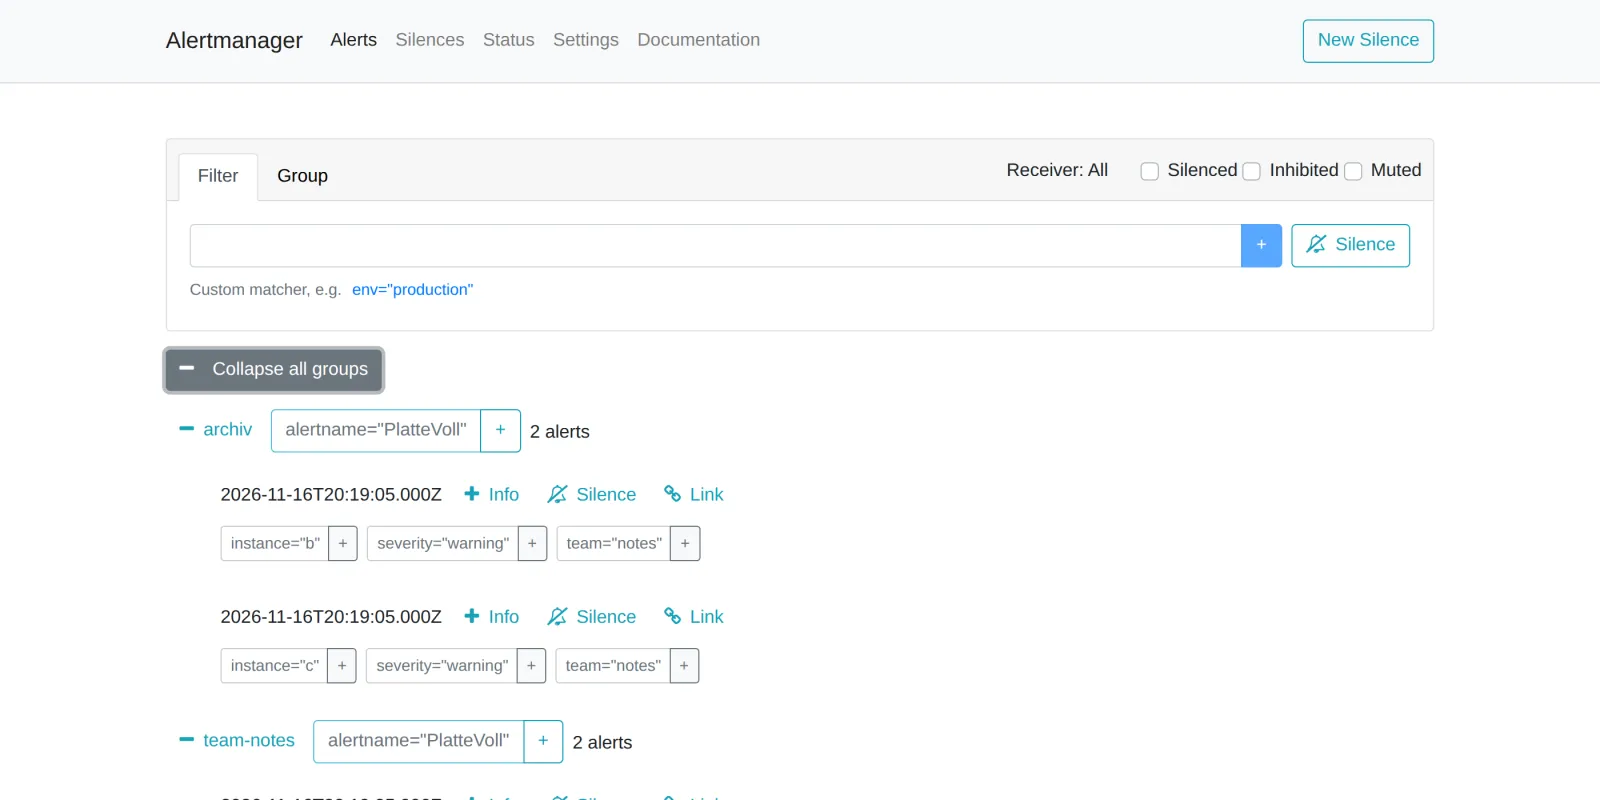
[{"url":"http://alertmanager:9093/api/v2/alerts"}]Prometheus speaks Alertmanager’s API v2. The Alertmanager web UI is
at http://172.16.0.61:9093. It lists alerts by receiver and
group, can filter and can create silences. With more than a handful of
alerts, it quickly becomes cluttered. That is exactly what karma is for,
from Day 7 on.
Save your progress? Sign up for free
Drill 5: The First Notification
docker compose stop notes-apiAfter just under two minutes (one minute of for, plus
evaluation and 30 seconds of group_wait):
amtool alertExpected:
Alertname     Starts At                Summary                                       State
NotesApiDown  2026-11-16 19:23:13 UTC  notes-api auf notes-api:8080 antwortet nicht  active
docker compose logs --no-log-prefix alarm-logExpected:
19:23:43 / alarm-log firing [alertname=NotesApiDown] NotesApiDown (1 firing, 0 resolved)Between Starts At (19:23:13) and the notification
(19:23:43) there are exactly 30 seconds. That is
group_wait: after the first alert of a new group,
Alertmanager waits to see whether more arrive. What reached the
receiver?
curl -s localhost:5001 | jq .Expected (shortened):
{
  "receiver": "alarm-log",
  "status": "firing",
  "alerts": [
    {
      "status": "firing",
      "labels": {
        "alertname": "NotesApiDown",
        "env": "prod",
        "instance": "notes-api:8080",
        "job": "notes-api",
        "severity": "critical",
        "team": "notes"
      },
      "annotations": {
        "runbook_url": "https://wiki.example.com/runbooks/notes-api-down",
        "summary": "notes-api auf notes-api:8080 antwortet nicht"
      },
      "startsAt": "2026-11-16T19:23:13.784Z",
      "endsAt": "0001-01-01T00:00:00Z",
      "generatorURL": "http://172.16.0.61:9090/graph?g0.expr=up%7Bjob…",
      "fingerprint": "12201e3a4fb380a7"
    }
  ],
  "notification_reason": "first notification",
  "groupLabels": {
    "alertname": "NotesApiDown"
  },
  "commonLabels": { … },
  "commonAnnotations": { … },
  "externalURL": "http://172.16.0.61:9093",
  "version": "4",
  "groupKey": "{}:{alertname=\"NotesApiDown\"}",
  "truncatedAlerts": 0
}
env: prodis there now. Prometheus attached theexternal_labelswhen sending.generatorURLpoints to your VM, thanks to--web.external-urlfrom Day 1.groupKeyidentifies the group:{}is the route (the root), followed by the group labels.fingerprintis a hash over all labels. Same labels, same alert.
Start notes-api again:
docker compose start notes-apiThe resolved message does not come immediately. Alertmanager only
sends changes to a group after group_interval, five minutes
by default. After that time:
docker compose logs --no-log-prefix alarm-log | tail -1Expected:
19:28:43 / alarm-log resolved [alertname=NotesApiDown] NotesApiDown (0 firing, 1 resolved)Save your progress? Sign up for free
Drill 6: Test Alerts Without Prometheus
For the routing exercises from Day 3 on, you do not want to stop a
container every time. amtool can send alerts itself:
amtool alert add alertname=Testalarm severity=info team=notes \
  --annotation='summary="Von Hand ausgelöst"'
amtool alert query alertname=Testalarm
Expected:
Alertname  Starts At                Summary             State
Testalarm 2026-11-16 19:09:15 UTC Von Hand ausgelöst active- Labels go as
name=wertdirectly afteradd. - Values with spaces need double quotes inside the single quotes.
Without them,
amtoolwarns that it fell back to the old matcher parser.
How long does such an alert live?
amtool alert query alertname=Testalarm -o json | jq '.[0] | {startsAt, endsAt}'Expected:
{
  "startsAt": "2026-11-16T19:09:15.695Z",
  "endsAt": "2026-11-16T19:14:15.695Z"
}
Five minutes, that is resolve_timeout from the global
configuration. Prometheus resends its alerts continuously and pushes
endsAt further into the future each time. A hand-made alert
gets no refresh and resolves itself after five minutes.
amtool also shows the configuration as Alertmanager
understood it, with all default values:
amtool config routesExpected:
Routing tree:
.
└── default-route  receiver: alarm-log
amtool config show prints the whole configuration,
including resolve_timeout: 5m and
send_resolved: true on the webhook.
Save your progress? Sign up for free
Checkpoint
amtool check-config alertmanager/alertmanager.ymlExpected: SUCCESS and 1 receivers.
curl -s localhost:9090/api/v1/alertmanagers | jq -c '.data.activeAlertmanagers'Expected: one entry with
http://alertmanager:9093/api/v2/alerts.
docker compose logs --no-log-prefix alarm-logExpected: at least one firing line and one
resolved line for NotesApiDown.
Challenge
What happens when the receiver is unreachable? Stop
alarm-log, trigger a test alert and find out in
Alertmanager’s log and metrics what it does. Then start
alarm-log again. Does the message still arrive?
Note: Alertmanager has its own
/metrics. Search for
notification_requests.
Solution
docker compose stop alarm-log
amtool alert add alertname=Empfaengertest severity=info
After a little over 30 seconds:
docker compose logs --no-log-prefix alertmanager | tail -1Expected (wrapped):
time=2026-11-16T19:20:33.347Z level=WARN source=retry_stage.go:174
msg="Notify attempt failed, will retry later" component=dispatcher
receiver=alarm-log integration=webhook[0]
aggrGroup="{}:{alertname=\"Empfaengertest\"}" attempts=1 reason=other
err="Post \"<redacted>\": dial tcp: lookup alarm-log on 127.0.0.11:53: server misbehaving"
curl -s localhost:9093/metrics | grep notification_requestsExpected (shortened):
alertmanager_notification_requests_failed_total{integration="webhook"} 9
alertmanager_notification_requests_total{integration="webhook"} 21
Alertmanager retries with increasing intervals. It redacts the URL in the log because webhook URLs often contain tokens. Now start the receiver again:
docker compose start alarm-logAfter one minute at most:
docker compose logs --no-log-prefix alarm-log | tail -1Expected:
19:20:54 / alarm-log firing [alertname=Empfaengertest] Empfaengertest (1 firing, 0 resolved)The message arrives. Alertmanager only gives up if no attempt has
succeeded by the next round (group_interval). Only then
does alertmanager_notifications_failed_total count. An
alert belongs on exactly this metric, but not via the same path that is
currently broken.
Save your progress? Sign up for free
Enterprise Note
alertmanager_notifications_failed_totalbelongs in every monitoring of the monitoring. The alert on it needs a second path, such as a different receiver.- Webhook URLs with tokens (Slack, Teams) do not belong in Git.
Alertmanager can read them from a file with
url_file. - Always set
--web.external-url, for Prometheus as well as for Alertmanager. Otherwise the links in every notification lead nowhere. - Test alerts via
amtool alert addare a good tool to check the chain all the way to the receiver after every configuration change.