Day 12: Observing
Goal: Monitor Kong with Prometheus and Grafana, log every request as JSON and use OpenTelemetry to see where a request spends its time. · Duration: approx. 75 min · Prerequisite: Day 11
Briefing
- Metrics: The
prometheusplugin counts requests, status codes and latencies; Kong serves them on status port 8100 under/metrics. - Logs: Plugins such as
file-log,http-logorsyslogwrite one JSON entry per request with consumer, service, route and latencies. - Traces:
opentelemetrysends spans for the router, every plugin, DNS and the backend to a collector, here Jaeger. - Prometheus, Grafana and Jaeger run as a separate Compose project in
the
labnetwork.
 Kong :8100/metrics ◄── Prometheus :9090 ◄── Grafana :3000
 Kong ──OTLP :4318──► Jaeger :16686
 Kong ──file-log──► /tmp/zugriff.json
Drill 1: Prepare Kong for Traces
Kong generates spans only when tracing is turned on. That is a setting of the node, not a plugin:
source ~/kong-lab/setup/env.sh
mkdir -p ~/kong-lab/tag12 && cd ~/kong-lab/kong
cp ~/kong-lab/code/tag12/compose.yaml compose.yaml
grep TRACING compose.yaml
docker compose up -d --wait
Expected (shortened):
      KONG_TRACING_INSTRUMENTATIONS: all     # Spans für OpenTelemetry (Tag 12)
      KONG_TRACING_SAMPLING_RATE: "1.0"
 Container kong-kong-1 Healthy
all measures router, plugins, DNS and balancer.
1.0 means: every request. In production, a few percent is
often enough.
Save your progress? Sign up for free
Drill 2: Three Plugins for All Requests
cd ~/kong-lab/tag12
cp ~/kong-lab/code/tag12/beobachten.yaml .
grep -E 'name:|path|endpoint' beobachten.yaml
deck file add-plugins -s ~/kong-lab/kong/kong.yaml beobachten.yaml \
  -o ~/kong-lab/kong/kong.yaml
ksync 2>/dev/null | tail -3
Expected:
      - name: prometheus
      - name: file-log
          path: /tmp/zugriff.json
      - name: opentelemetry
          traces_endpoint: http://jaeger:4318/v1/traces
  Created: 3
  Updated: 0
  Deleted: 0
Save your progress? Sign up for free
Drill 3: Prometheus, Grafana, Jaeger
You get the “Kong (official)” dashboard from grafana.com. It expects a variable for the data source, which you replace with the fixed ID from the provisioning:
cp -R ~/kong-lab/code/observability ~/kong-lab/observability
cd ~/kong-lab/observability
grep image compose.yaml
curl -s https://grafana.com/api/dashboards/7424/revisions/11/download \
  -o grafana/dashboards/kong.json
jq -r .title grafana/dashboards/kong.json
sed -i 's/${DS_PROMETHEUS}/prometheus/g' grafana/dashboards/kong.json
docker compose up -d
sleep 15
curl -s localhost:9090/api/v1/targets | jq -r '.data.activeTargets[] | [.labels.job,
  .health] | @tsv'
Expected (shortened):
    image: prom/prometheus:v3.15.1
    image: grafana/grafana:13.2.5
    image: jaegertracing/jaeger:2.22.0
Kong (official)
 Container observability-grafana-1 Started
kong    up
Prometheus scrapes kong:8100 every 5 seconds
(prometheus.yml). The status port is reachable in the
lab network, and to the outside only on
127.0.0.1.
Save your progress? Sign up for free
Drill 4: Reading Metrics
Generate some traffic and look at the raw data:
for i in $(seq 1 30); do
  curl -s -o /dev/null $PROXY/api/v1/version
  curl -s -o /dev/null -H 'apikey: lab-key-anna-456' $PROXY/whoami
done
curl -s localhost:8100/metrics | grep '^kong_http_requests_total'
curl -s localhost:8100/metrics \
  | grep -E '^kong_(datastore_reachable|upstream_target_health)'
Expected (shortened):
kong_http_requests_total{service="notes-version",route="notes-version",code="200",
source="service",workspace="default",consumer=""} 30
kong_http_requests_total{service="whoami",route="whoami",code="200",source="service",
workspace="default",consumer="anna"} 30
kong_datastore_reachable 1
kong_upstream_target_health{upstream="notes-up",target="notes-api-2:8080",address="172…
…
kong_upstream_target_health{…,target="notes-api:8080",…,state="healthy",…} 1
per_consumer: true counts per consumer: anna is visible.
And Prometheus can do the math:
sleep 8
Q='sum(kong_http_requests_total) by (service,code)'
curl -s localhost:9090/api/v1/query --data-urlencode "query=$Q" \
  | jq -r '.data.result[] | [.metric.service, .metric.code, .value[1]] | @tsv' | sort
Expected:
notes-version   200 30
whoami  200 30
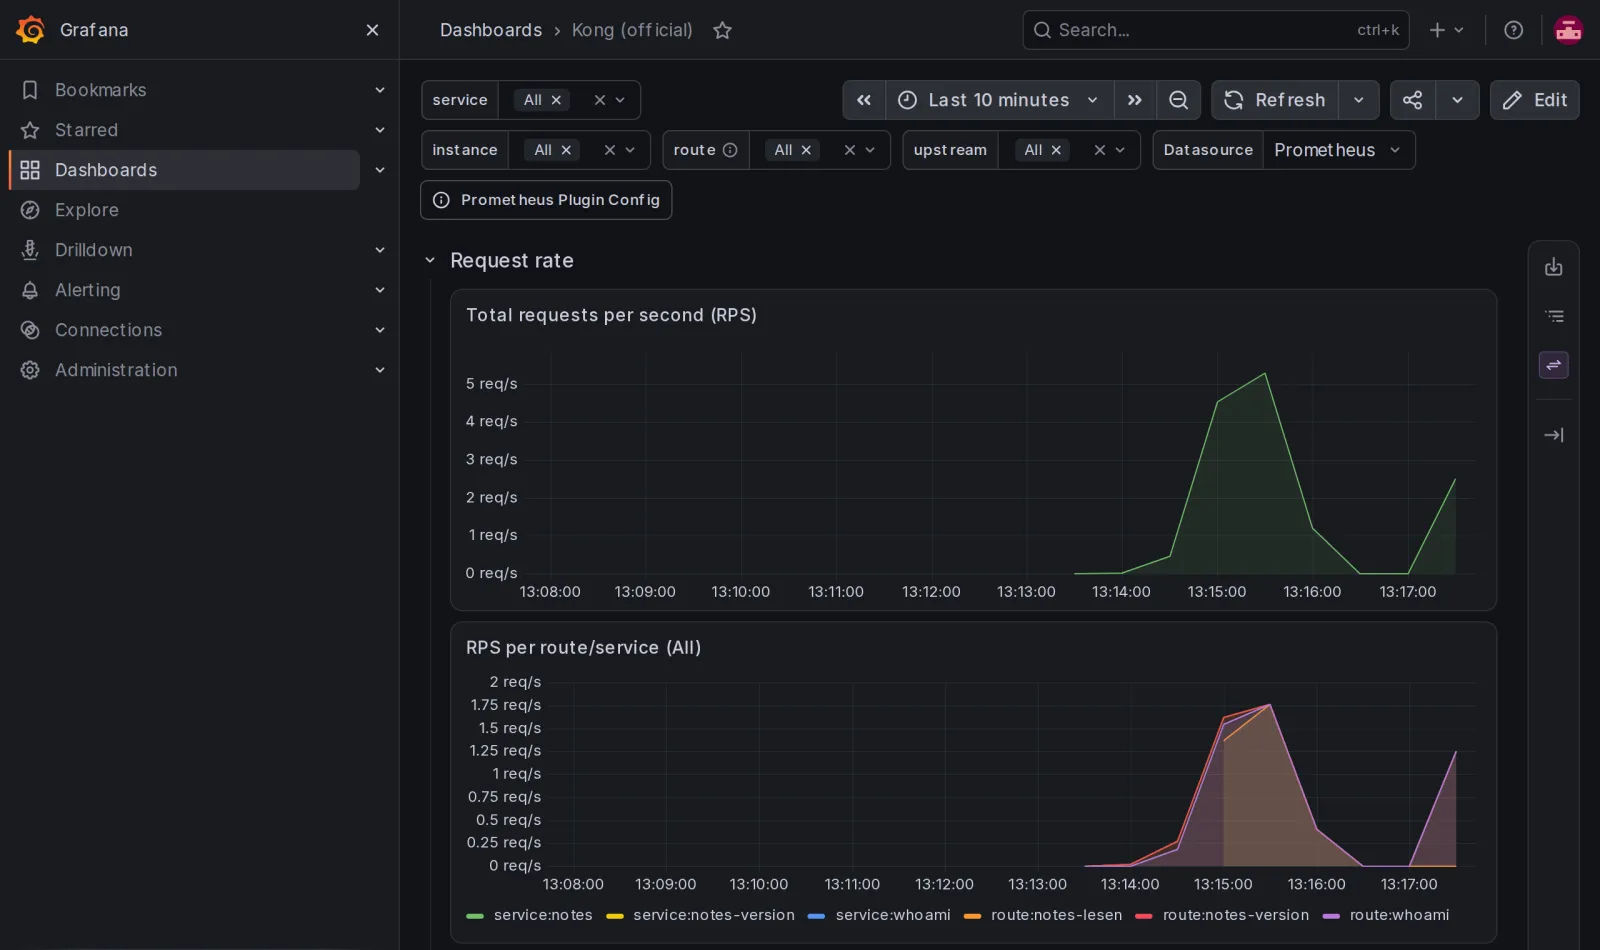
Open Grafana through the tunnel (-L 3000:localhost:3000,
user admin, password lab-admin-pw-123), then
Dashboards, Kong (official) and the
Request rate section:
Save your progress? Sign up for free
Drill 5: A Request in the Log
curl -s -o /dev/null -H 'apikey: lab-key-anna-456' $PROXY/whoami
docker compose -f ~/kong-lab/kong/compose.yaml exec kong tail -1 /tmp/zugriff.json \
  | jq '{methode: .request.method, uri: .request.uri, status: .response.status,
    consumer: .consumer.username, service: .service.name, latencies}'
Expected (shortened, your times will differ):
{
  "methode": "GET",
  "uri": "/whoami",
  "status": 200,
  "consumer": "anna",
  "service": "whoami",
  "latencies": {
    "receive": 0,
    "request": 5,
    "kong": 3,
    "proxy": 2
  }
}
kong is the time spent in Kong itself (plugins),
proxy the time in the backend, request the
whole request. If kong rises, the problem is in the
gateway; if proxy rises, in the backend.
Security: The full entry also contains the request headers. Kong does not redact
Authorizationandapikeyon its own; check what ends up in your logs before they go to a central system.
Save your progress? Sign up for free
Drill 6: Where the Time Goes
for i in 1 2 3; do
  curl -s -o /dev/null -H 'apikey: lab-key-anna-456' $PROXY/whoami
done
sleep 4
curl -s localhost:16686/api/v3/services | jq -c .
Expected:
{"services":["kong"]}Jaeger 2 offers its query API under /api/v3. The UI is
more convenient: tunnel with -L 16686:localhost:16686, then
http://localhost:16686, service kong,
Find Traces, and open a request to /whoami
with a token.
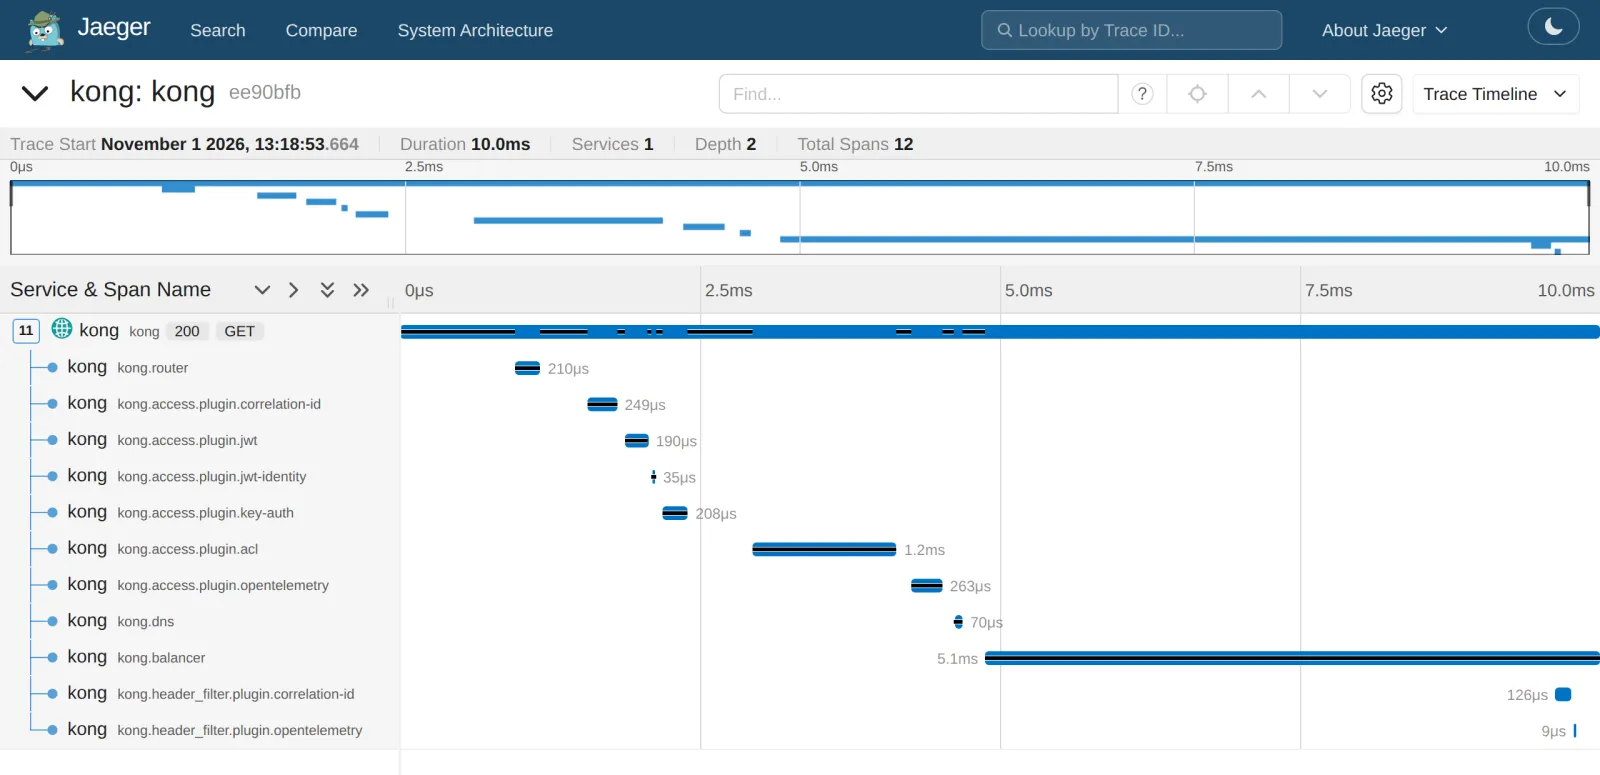
Every plugin is its own bar, including your
jwt-identity. The longest section is
kong.balancer: that is the time until the backend
responds.
Save the state:
cd ~/kong-lab/kong
git add compose.yaml kong.yaml && git commit -qm "Tag 12: Metriken, Logs, Traces"
Save your progress? Sign up for free
Checkpoint
curl -s localhost:8100/metrics | grep -c '^kong_http_requests_total'Expected: at least two time series.
2curl -s localhost:9090/api/v1/targets | jq -r '.data.activeTargets[0].health'Expected: Prometheus reaches Kong.
upcurl -s localhost:16686/api/v3/services | jq -r '.services[0]'Expected: Jaeger knows the service kong.
kongChallenge
How many requests has Kong answered since startup with a status code of 400 or above, broken down by code? Generate a few errors first.
Note: kong_http_requests_total has a
code label; PromQL supports regular expressions with
=~.
Solution
for i in 1 2 3; do
  curl -s -o /dev/null $PROXY/whoami
  curl -s -o /dev/null $PROXY/api/v1/version/gibtsnicht
done
sleep 10
Q='sum(kong_http_requests_total{code=~"4.."}) by (code)'
curl -s localhost:9090/api/v1/query --data-urlencode "query=$Q" \
  | jq -r '.data.result[] | [.metric.code, .value[1]] | @tsv' | sort
Expected:
403 3
404 3
Without a key, /whoami ends up as gast and
fails at the ACL: 403, not 401 (Day 6). And notes-api passes
/api/v1/version/gibtsnicht through as 404. For alerts, use
the rate instead of the total since startup, for example
sum(rate(kong_http_requests_total{code=~"5.."}[5m])); but
it needs a few data points before it shows anything.
Save your progress? Sign up for free
Enterprise Note
- Alerts: Prometheus rules for error rate (5xx),
latency (p95 from
kong_request_latency_ms),kong_datastore_reachable == 0and sick targets. - Central logs:
http-logto Loki, Elasticsearch or a collector, withcustom_fields_by_luafor redacting and enriching. - Sampling: 100 % traces cost money. Usual is a few percent plus all errors, or tail sampling in the OpenTelemetry Collector.
- Konnect ships analytics; in OSS you build it yourself as shown here.
- Cardinality:
per_consumerwith thousands of consumers bloats Prometheus; in that case, evaluate via logs instead.