Day 17: Monitoring – Metrics and Dashboards
Goal: Prometheus collects DRBD metrics from drbd-reactor on all four hosts and LINSTOR metrics from the controller via the VIP, and two Grafana dashboards show state and space at a glance. · Duration: approx. 75 min · Prerequisite: Day 16
Briefing
- Two sources: On every host, drbd-reactor delivers
the actual state of DRBD under
:9942. The controller delivers the desired state from LINSTOR under:3370/metrics– nodes, resources, pools, error reports. - Both run outside Kubernetes. Prometheus fetches them via static targets, the controller always via the VIP – it moves.
- kube-prometheus-stack (
kps) brings Prometheus, Alertmanager, Grafana, node-exporter and kube-state-metrics. RAM is tight: retention of 2 days, small requests.
 k0s-ctrl :9942 ─┐
 k0s-w1   :9942 ─┤   job linstor-node        ┌─────────────┐    ┌─────────┐
 k0s-w2   :9942 ─┼──────────────────────────>│ Prometheus  │───>│ Grafana │
 k0s-w3   :9942 ─┘                           │ (monitoring)│    └─────────┘
 VIP 10.10.0.100:3370 ── job linstor-controller ──>└─────────────┘
Drill 1: drbd-reactor as an exporter
The metrics are a plugin of drbd-reactor. You extend the role from Day 16 – that way, future hosts get the plugin as well:
# on k0s-ctrl
mkdir -p ~/k0s-lab/tag17
cd ~/k0s-lab/tag16
cat >> roles/linstor/tasks/main.yml <<'EOF'

- name: DRBD-Metriken über drbd-reactor (Tag 17)
  ansible.builtin.copy:
    dest: /etc/drbd-reactor.d/prometheus.toml
    content: |
      [[prometheus]]
      enums = true
      address = ":9942"
    mode: "0644"
  notify: drbd-reactor neu laden
EOF
cat >> roles/linstor/handlers/main.yml <<'EOF'

# reload, never restart (Day 16): else the controller chain stops on the active node
- name: drbd-reactor neu laden
  ansible.builtin.systemd_service:
    name: drbd-reactor
    state: reloaded
EOF
ansible-playbook site.yml | grep -E -A5 'Metriken|RUNNING HANDLER'
Expected (abridged):
TASK [linstor : DRBD-Metriken über drbd-reactor (Tag 17)] **********************
changed: [k0s-ctrl]
changed: [k0s-w1]
...
RUNNING HANDLER [linstor : drbd-reactor neu laden] *****************************
changed: [k0s-w1]
changed: [k0s-ctrl]
...
The German task name means “DRBD metrics via drbd-reactor (Day 17)”,
the handler “reload drbd-reactor”, and the comment in the handler file
“reload, never restart (Day 16): otherwise the controller chain stops on
the active node”. In the lab, the measuring instrument from Day 6 ran
against the VIP in parallel: 70 seconds, ok 70 times. The
reload rereads the configuration without touching the
promoter. What arrives?
# on k0s-ctrl
ssh k0s-w3 'curl -s localhost:9942/metrics' \
  | grep -E '^drbd_(resource_role|device_quorum)'
Expected (abridged):
drbd_resource_role{name="pvc-11dccaf7-...",drbd_resource_role="Unknown"} 0
drbd_resource_role{name="pvc-11dccaf7-...",drbd_resource_role="Primary"} 1
drbd_resource_role{name="pvc-11dccaf7-...",drbd_resource_role="Secondary"} 0
...
drbd_device_quorum{name="pvc-11dccaf7-...",volume="0",minor="1001"} 1
drbd_device_quorum{name="linstor_db",volume="0",minor="1000"} 1
enums = true writes states as one time series per
possible value; the current one has 1. That way, you can
query for “not Connected” without knowing numeric
codes.
Save your progress? Sign up for free
Drill 2: The controller’s metrics
The VIP lives in the storage network – query it from a worker:
# on k0s-ctrl
ssh k0s-w1 'curl -s http://10.10.0.100:3370/metrics' \
  | grep -E '^linstor_(info|node_state)' | cut -c1-88
ssh k0s-w1 'curl -s http://10.10.0.100:3370/metrics' \
  | grep '^# HELP linstor_node_state' | cut -c1-88
Expected (abridged):
linstor_info{gitid="75d5fa72d504ccfe55c421ccccda9505af8371f8",buildtime="2026-10-21T...
linstor_node_state{node="k0s-ctrl",address="172.16.0.176",nodetype="SATELLITE",encry...
linstor_node_state{node="k0s-w1",address="10.10.0.11",nodetype="SATELLITE",encryptio...
...
# HELP linstor_node_state 0="OFFLINE", 1="CONNECTED", 2="ONLINE", 3="VERSION_MISMATC...
Here, states are numbers, and the legend is in # HELP:
2 means ONLINE, 3 the version mix
from Day 15. Can the Pods reach both sources? A test Pod is enough:
# on k0s-ctrl
kubectl run nettest --rm -i --restart=Never --image=busybox:1.37 -- \
  sh -c 'wget -qO- -T 3 http://172.16.0.176:9942/metrics | grep -c drbd'
Expected (abridged):
197
pod "nettest" deleted from default namespace
The witness is reachable from the Pod network too: kube-router masquerades traffic from the Pod network that leaves the cluster to the node address.
Save your progress? Sign up for free
Drill 3: kube-prometheus-stack
# on k0s-ctrl
cd ~/k0s-lab/tag17
helm repo add prometheus-community https://prometheus-community.github.io/helm-charts
helm repo update
cat > kps-werte.yaml <<'EOF'
fullnameOverride: kps
# k0s: controller components do not run as Pods on a node
kubeControllerManager: {enabled: false}
kubeScheduler: {enabled: false}
kubeEtcd: {enabled: false}
defaultRules:
  rules:
    etcd: false
    kubeControllerManager: false
    kubeSchedulerAlerting: false
    kubeSchedulerRecording: false
alertmanager:
  alertmanagerSpec:
    retention: 48h
    resources: {requests: {cpu: 10m, memory: 40Mi}}
grafana:
  adminPassword: lab-grafana-123
  resources: {requests: {cpu: 50m, memory: 128Mi}}
  sidecar:
    dashboards: {searchNamespace: monitoring}
prometheusOperator:
  resources: {requests: {cpu: 20m, memory: 64Mi}}
kube-state-metrics:
  resources: {requests: {cpu: 10m, memory: 32Mi}}
prometheus-node-exporter:
  resources: {requests: {cpu: 10m, memory: 24Mi}}
prometheus:
  prometheusSpec:
    retention: 2d
    retentionSize: 4GB
    resources: {requests: {cpu: 100m, memory: 400Mi}}
    serviceMonitorSelectorNilUsesHelmValues: false
    podMonitorSelectorNilUsesHelmValues: false
    ruleSelectorNilUsesHelmValues: false
    storageSpec:
      volumeClaimTemplate:
        spec:
          storageClassName: linstor-replicated
          accessModes: [ReadWriteOnce]
          resources: {requests: {storage: 5Gi}}
    additionalScrapeConfigs:
      - job_name: linstor-node
        static_configs:
          - targets: [172.16.0.176:9942]
            labels: {instance: k0s-ctrl, node: k0s-ctrl}
          - targets: [172.16.0.186:9942]
            labels: {instance: k0s-w1, node: k0s-w1}
          - targets: [172.16.0.36:9942]
            labels: {instance: k0s-w2, node: k0s-w2}
          - targets: [172.16.0.72:9942]
            labels: {instance: k0s-w3, node: k0s-w3}
      - job_name: linstor-controller
        static_configs:
          - targets: [10.10.0.100:3370]
            labels: {instance: linstor-controller, node: vip}
EOF
helm install kps prometheus-community/kube-prometheus-stack --version 93.4.1 \
  -n monitoring --create-namespace -f kps-werte.yaml --wait --timeout 10m
kubectl -n monitoring get pod -o wide | awk '{print $1, $3, $7}' | column -t
Expected (abridged, a good 3 min):
NAME                                    STATUS   NODE
alertmanager-kps-alertmanager-0         Running  k0s-w2
kps-grafana-7fd75969bc-gcqwb            Running  k0s-w3
kps-kube-state-metrics-7dd67b558-lr6nb  Running  k0s-w3
kps-operator-84fc586db9-2j8bp           Running  k0s-w3
kps-prometheus-node-exporter-fpq7s      Running  k0s-w3
kps-prometheus-node-exporter-pql5l      Running  k0s-w2
kps-prometheus-node-exporter-qnhv4      Running  k0s-w1
prometheus-kps-prometheus-0 Running k0s-w2| Value | Why |
|---|---|
kubeEtcd, kubeScheduler,
kubeControllerManager off |
with k0s, they run as processes under the k0scontroller
service, not as Pods on a node |
retention: 2d, retentionSize |
RAM and space are tight |
*SelectorNilUsesHelmValues: false |
Prometheus also picks up your own rules (Day 18) |
instance and node on every target |
readable names instead of 172.16.0.72:9942 |
The comment in the values file says the same as the first row: the
controller components do not run as Pods on a node. node-exporter only
runs on the three workers: with k0s, k0s-ctrl is not a
Kubernetes node. The Prometheus data lives on its own volume from
linstor-replicated.
Save your progress? Sign up for free
Drill 4: The targets and first queries
Open a second terminal for access to Prometheus:
# on k0s-ctrl
kubectl -n monitoring port-forward svc/kps-prometheus 9090:9090
Back in the first terminal. jq reads the JSON responses;
if it is missing on k0s-ctrl, install it with
sudo apt-get install -y jq.
# on k0s-ctrl
curl -s localhost:9090/api/v1/query --data-urlencode 'query=up{job=~"linstor.*"}' \
  | jq -r '.data.result[] | "\(.metric.job) \(.metric.instance) \(.value[1])"'
Expected (order may differ):
linstor-node k0s-w3 1
linstor-node k0s-ctrl 1
linstor-node k0s-w2 1
linstor-node k0s-w1 1
linstor-controller linstor-controller 1
Where is what Primary? The answer from DRBD itself:
# on k0s-ctrl
curl -s localhost:9090/api/v1/query \
  --data-urlencode 'query=drbd_resource_role{drbd_resource_role="Primary"} == 1' \
  | jq -r '.data.result[] | "\(.metric.instance) \(.metric.name)"'
Expected:
k0s-w3 pvc-11dccaf7-...
k0s-w2 linstor_db
k0s-w2 pvc-571bd51f-...
linstor_db on k0s-w2 – the controller has
been running there since Day 15. The new volume is the one of Prometheus
itself. Free space according to LINSTOR:
# on k0s-ctrl
curl -s localhost:9090/api/v1/query --data-urlencode \
  'query=round(linstor_storage_pool_capacity_free_bytes{driver="LVM"} / 2^30, 0.01)' \
  | jq -r '.data.result[]
      | "\(.metric.exported_node) \(.metric.storage_pool) \(.value[1])"'
Expected:
k0s-w1 pool_data 24.79
k0s-w2 pool_data 22.79
k0s-w3 pool_data 27.79
k0s-w1 pool_nvme 1.74
k0s-w2 pool_nvme 1.64
k0s-w3 pool_nvme 1.89
Why exported_node? The target itself carries a label
node (vip). Prometheus therefore renames the
metric’s label of the same name to exported_node. This is
exactly what the dashboard in Drill 6 expects.
Save your progress? Sign up for free
Drill 5: A dashboard of your own
The Grafana sidecar loads every ConfigMap with the label
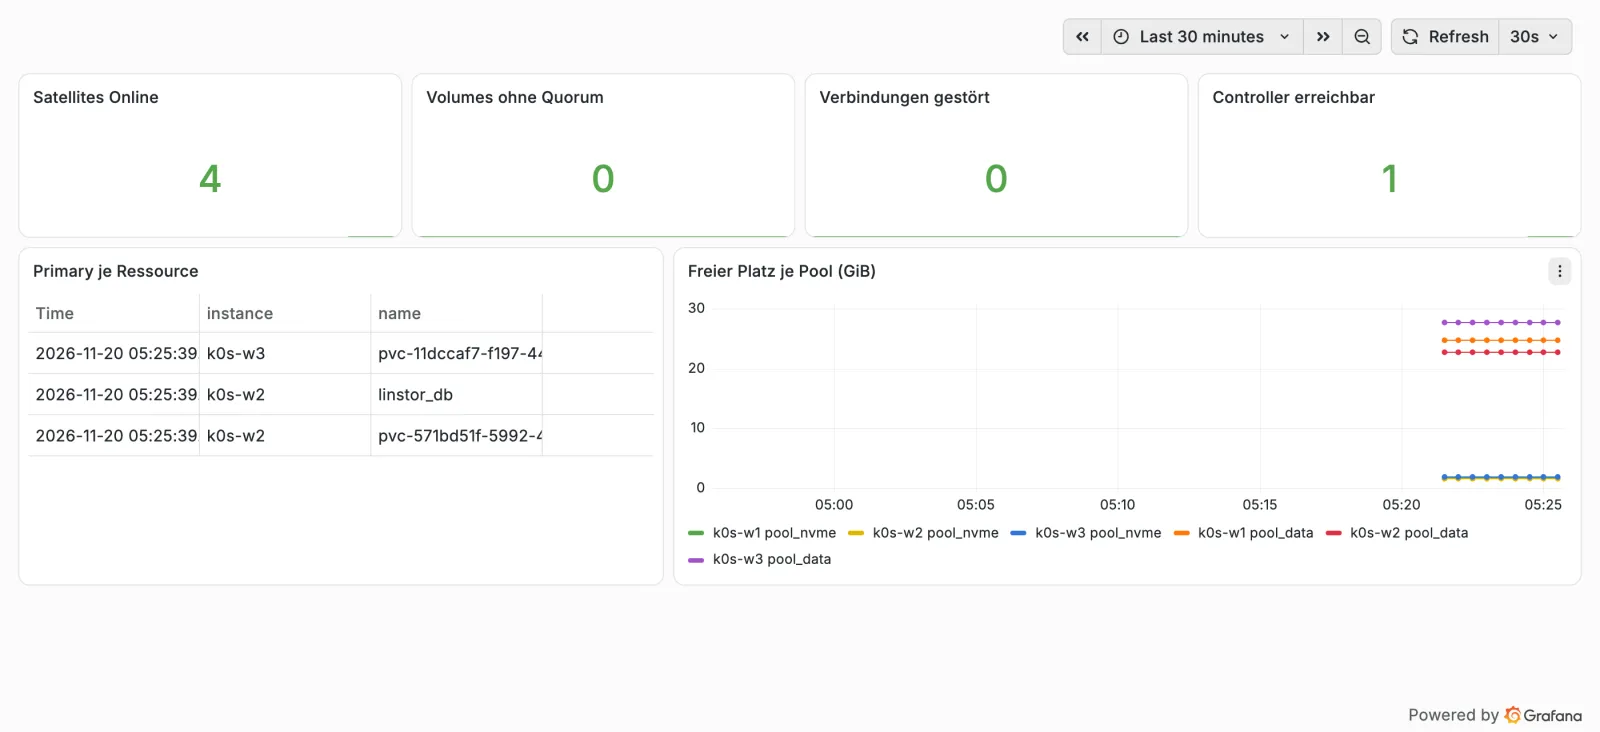
grafana_dashboard=1 as a dashboard. Four numbers, a table
and a time series are enough for a first look:
# on k0s-ctrl
cat > k0s-linstor.json <<'EOF'
{
  "title": "k0s-LINSTOR Übersicht",
  "uid": "k0s-linstor",
  "time": {"from": "now-1h", "to": "now"},
  "refresh": "30s",
  "panels": [
    {"type": "stat", "title": "Satellites Online",
     "gridPos": {"x": 0, "y": 0, "w": 6, "h": 4},
     "targets": [{"expr": "count(linstor_node_state == 2)"}]},
    {"type": "stat", "title": "Volumes ohne Quorum",
     "gridPos": {"x": 6, "y": 0, "w": 6, "h": 4},
     "targets": [{"expr": "count(drbd_device_quorum == 0) or vector(0)"}]},
    {"type": "stat", "title": "Verbindungen gestört",
     "gridPos": {"x": 12, "y": 0, "w": 6, "h": 4},
     "targets": [{"expr":
"count(drbd_connection_state{drbd_connection_state=\"Connected\"}==0) or vector(0)"}]},
    {"type": "stat", "title": "Controller erreichbar",
     "gridPos": {"x": 18, "y": 0, "w": 6, "h": 4},
     "targets": [{"expr": "up{job=\"linstor-controller\"}"}]},
    {"type": "table", "title": "Primary je Ressource",
     "gridPos": {"x": 0, "y": 4, "w": 10, "h": 8},
     "targets": [{"expr":
"max by (name, instance) (drbd_resource_role{drbd_resource_role=\"Primary\"})==1",
                  "format": "table", "instant": true}]},
    {"type": "timeseries", "title": "Freier Platz je Pool (GiB)",
     "gridPos": {"x": 10, "y": 4, "w": 14, "h": 8},
     "targets": [{"expr":
       "linstor_storage_pool_capacity_free_bytes{driver=\"LVM\"}/2^30",
                  "legendFormat": "{{exported_node}} {{storage_pool}}"}]}
  ]
}
EOF
kubectl -n monitoring create configmap dash-k0s-linstor --from-file=k0s-linstor.json
kubectl -n monitoring label configmap dash-k0s-linstor grafana_dashboard=1
Expected:
configmap/dash-k0s-linstor created
configmap/dash-k0s-linstor labeled
The dashboard and panel titles are German because the screenshot shows them that way: „k0s-LINSTOR Übersicht“ means “k0s-LINSTOR overview”; the panels read “Volumes without quorum”, “Connections disrupted”, “Controller reachable”, “Primary per resource” and “Free space per pool (GiB)”.
You reach Grafana via port-forward just like Prometheus, in a third terminal:
# on k0s-ctrl
kubectl -n monitoring port-forward svc/kps-grafana 3000:80
From your workstation, use an SSH tunnel:
ssh -i ~/.ssh/homelab -L 3000:localhost:3000 [email protected],
then open http://localhost:3000 in the browser, user
admin, password lab-grafana-123. Dashboard
„k0s-LINSTOR Übersicht“:
Save your progress? Sign up for free
Drill 6: The community dashboard 15917
The dashboard “LINSTOR / DRBD” (grafana.com, no. 15917) comes from
the Piraeus ecosystem. It expects the jobs linstor-node and
linstor-controller as well as the labels node
and exported_node – hence the names in
kps-werte.yaml.
# on k0s-ctrl
curl -sSfL -o drbd-15917.json \
  https://grafana.com/api/dashboards/15917/revisions/latest/download
jq -r '.title, .templating.list[1].query.query' drbd-15917.json
kubectl -n monitoring create configmap dash-drbd-15917 --from-file=drbd-15917.json
kubectl -n monitoring label configmap dash-drbd-15917 grafana_dashboard=1
curl -s -u admin:lab-grafana-123 'localhost:3000/api/search?query=LINSTOR' \
  | jq -r '.[].title'
Expected (abridged):
LINSTOR / DRBD
label_values(drbdreactor_up, node)
configmap/dash-drbd-15917 created
configmap/dash-drbd-15917 labeled
k0s-LINSTOR Übersicht
LINSTOR / DRBD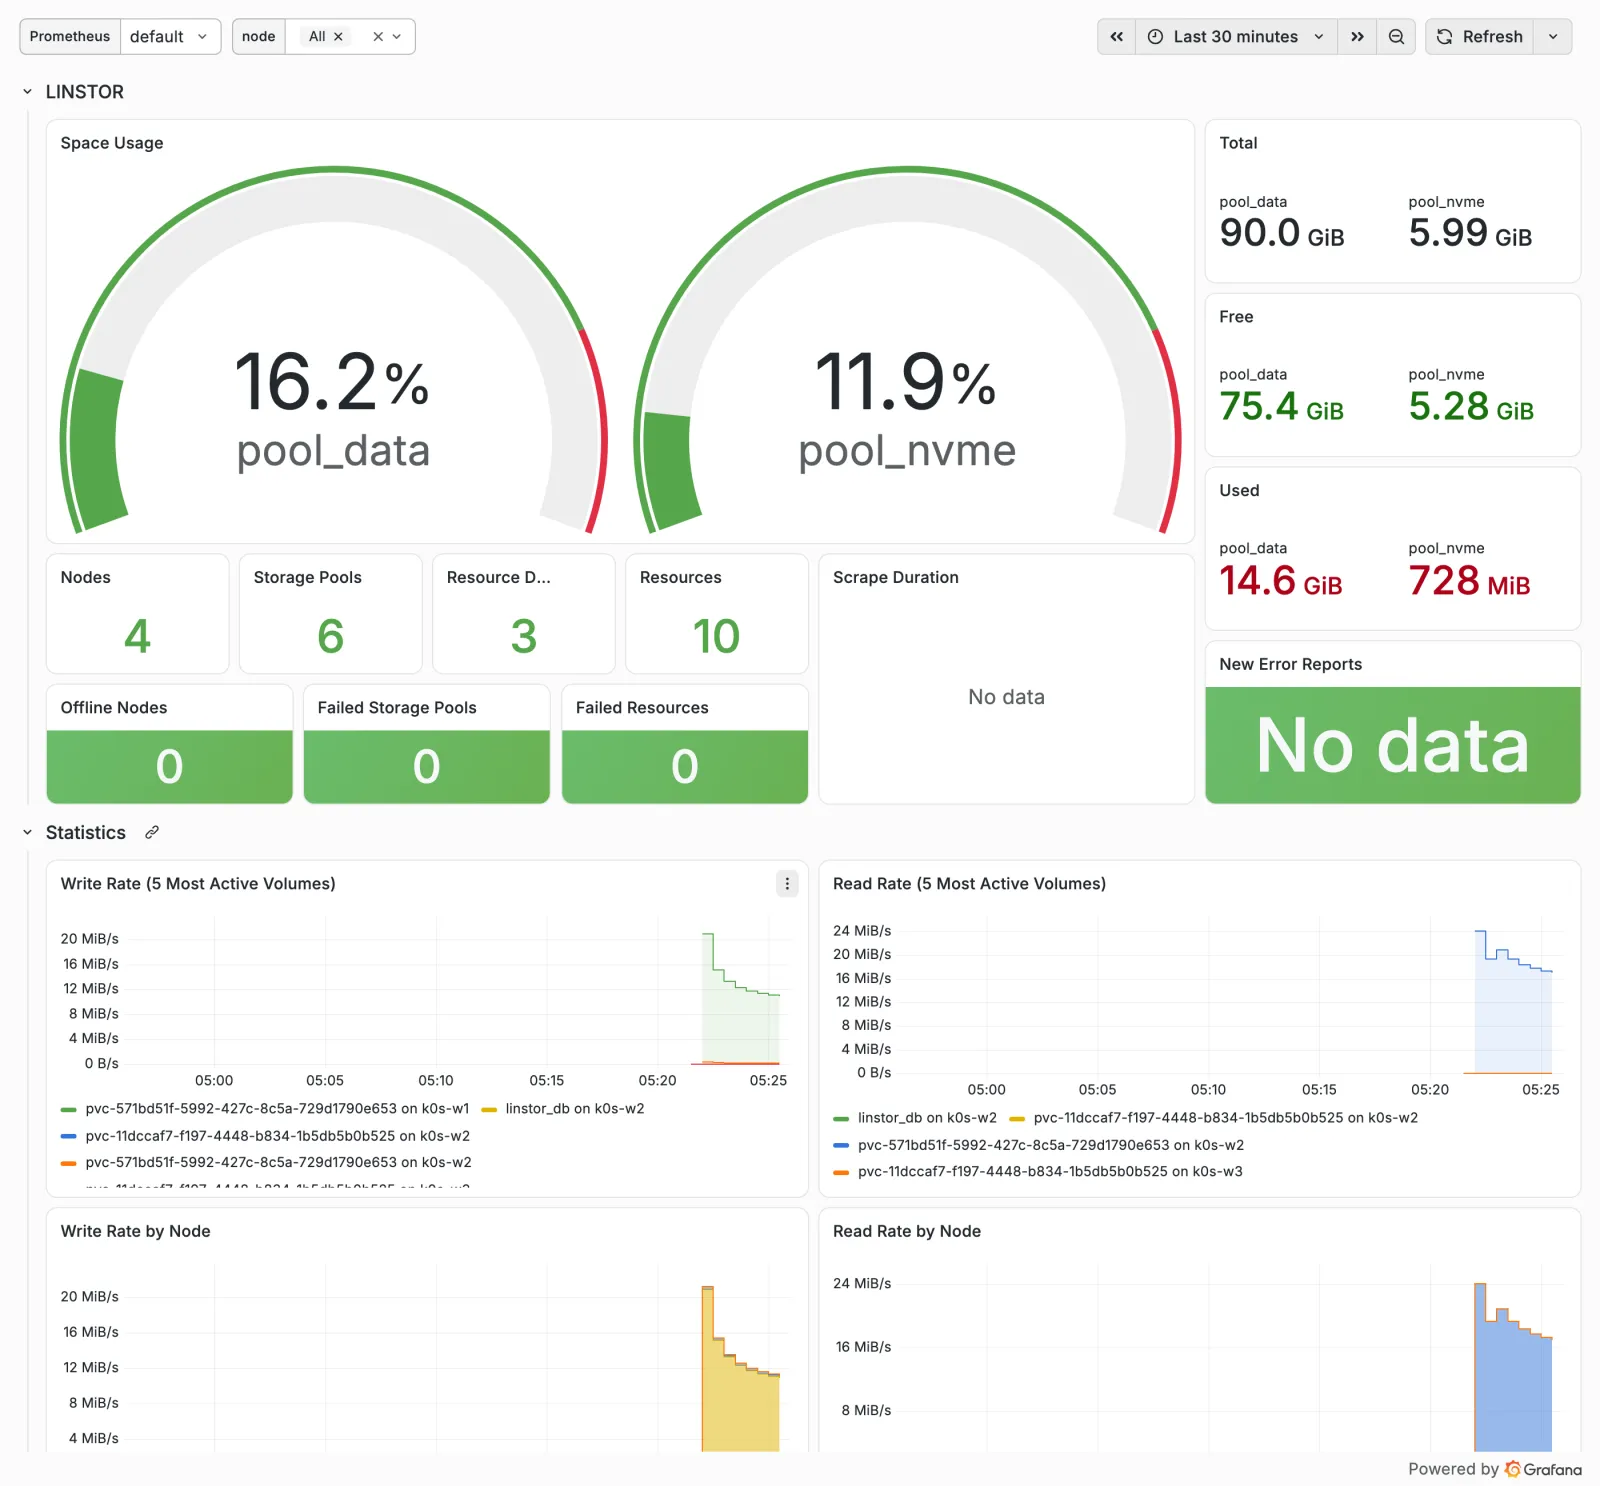
The numbers for pool_data add up all three workers (90
GiB). “Scrape Duration” stays empty because the query expects labels
that only a Piraeus setup with satellites in Pods delivers; “New Error
Reports” stays empty because no new error report was created in the time
window.
Save your progress? Sign up for free
Exercise: Speed Drills
- Show the retention and size limit of the Prometheus instance. Target time: 20 s
- Show how many metric lines drbd-reactor delivers on the witness. Target time: 15 s
- Show the titles of all dashboards with “LINSTOR” in their name. Target time: 20 s
- Show via PromQL which DRBD connections are not
Connected. Target time: 45 s
Solution
# on k0s-ctrl
kubectl -n monitoring get prometheus kps-prometheus \
  -o jsonpath='{.spec.retention} {.spec.retentionSize}{"\n"}'
curl -s localhost:9942/metrics | grep -c '^drbd'
curl -s -u admin:lab-grafana-123 'localhost:3000/api/search?query=LINSTOR' \
  | jq -r '.[].title'
curl -s localhost:9090/api/v1/query --data-urlencode \
  'query=drbd_connection_state{drbd_connection_state="Connected"} == 0' \
  | jq -r '.data.result[] | "\(.metric.instance) \(.metric.name) \(.metric.conn_name)"'
Expected:
2d 4GB
141
k0s-LINSTOR Übersicht
LINSTOR / DRBD
The last query prints nothing – all connections are up. It needs the port-forward on 9090, the third one the port-forward on 3000.
Save your progress? Sign up for free
Checkpoint
# on k0s-ctrl
helm -n monitoring list
Expected: kps with
kube-prometheus-stack-93.4.1, status
deployed.
# on k0s-ctrl
kubectl -n monitoring get pod
Expected: all Pods Running, three
node-exporters.
# on k0s-ctrl
curl -s localhost:9090/api/v1/query \
  --data-urlencode 'query=count(up{job=~"linstor.*"}==1)' \
  | jq -r '.data.result[0].value[1]'
Expected: 5 – four drbd-reactors and
the controller.
Challenge
Stop the satellite on k0s-w3 and show with Prometheus
that LINSTOR sees the node as OFFLINE, while DRBD on
k0s-w3 still has quorum. Start it again afterwards.
Hint: The desired state and the actual state come from different jobs – ask both.
Solution
# on k0s-ctrl
ssh k0s-w3 'sudo systemctl stop linstor-satellite'
sleep 45
curl -s localhost:9090/api/v1/query \
  --data-urlencode 'query=linstor_node_state{exported_node="k0s-w3"}' \
  | jq -r '.data.result[] | "\(.metric.exported_node) \(.value[1])"'
curl -s localhost:9090/api/v1/query \
  --data-urlencode 'query=drbd_device_quorum{instance="k0s-w3"}' \
  | jq -r '.data.result[] | "\(.metric.instance) \(.metric.name) \(.value[1])"'
kubectl -n demo logs deploy/pg-client --tail=1
ssh k0s-w3 'sudo systemctl start linstor-satellite'
Expected:
k0s-w3 0
k0s-w3 pvc-11dccaf7-... 1
k0s-w3 linstor_db 1
04:27:38 ok
0 means OFFLINE – LINSTOR cannot manage
k0s-w3. DRBD on k0s-w3 has quorum, and
pg-0 keeps writing there. This is Day 9 as a metric: when
in doubt, DRBD counts. An alert on linstor_node_state alone
would cause panic here, where only management is missing.
Save your progress? Sign up for free
Interview Note
- Where do DRBD metrics come from? From the Prometheus plugin
of drbd-reactor on every host (
:9942), not from the LINSTOR controller. - What does the controller measure, what does DRBD measure? The controller measures the desired state and management (nodes, pools, error reports), drbd-reactor the actual state (role, connection, quorum, out-of-sync).
- How do you monitor a controller that moves? Via the VIP as
a single target, with a fixed
instancelabel.
Enterprise Note
- Do not run the monitoring only on the storage it monitors: Prometheus with a local volume or outside the cluster, long-term data in Thanos or Mimir.
- Additionally monitor the witness and hosts without a kubelet with node-exporter as a systemd service.
- Open metric ports only to the monitoring network;
:3370is also the REST API for changes – in production with TLS and authentication. - Dashboards as code (ConfigMaps in Git or the Grafana Operator), not clicked together in the UI.
- More on Prometheus, Loki and alerts in operations: the drill book “Observability hands-on”.