Day 18: Logs and Alerts
Goal: The journal and the kernel log of the workers land in Loki, alerting rules for LINSTOR and DRBD are tested with
promtool, Alertmanager sends mails to Mailpit, and a real DRBD failure travels from the kernel log all the way to the mail. · Duration: approx. 75 min · Prerequisite: Day 17
Briefing
- DRBD reports every state change to the kernel log
(
conn( Connected -> NetworkFailure )). Alloy reads the journal on every worker and sends it to Loki. - Alerting rules are PromQL with a
forduration and labels. Withpromtool test rules, you check them against made-up time series before they wake someone up at night. - Alertmanager groups alerts and sends them out. In the lab, Mailpit catches all mails, without credentials.
- Lesson of the day: Not every loss of quorum is critical.
 Kernel/Journal ── Alloy (DaemonSet) ──> Loki ──────────────> Grafana Explore
 drbd-reactor, Controller ──> Prometheus ── rules ──> Alertmanager ──> Mailpit
Drill 1: Mailpit
# on k0s-ctrl
mkdir -p ~/k0s-lab/tag18 && cd ~/k0s-lab/tag18
cat > mailpit.yaml <<'EOF'
apiVersion: apps/v1
kind: Deployment
metadata: {name: mailpit, namespace: monitoring}
spec:
  replicas: 1
  selector: {matchLabels: {app: mailpit}}
  template:
    metadata: {labels: {app: mailpit}}
    spec:
      containers:
        - name: mailpit
          image: axllent/mailpit:v1.34.0
          ports: [{containerPort: 1025}, {containerPort: 8025}]
          resources: {requests: {cpu: 10m, memory: 32Mi}}
---
apiVersion: v1
kind: Service
metadata: {name: mailpit, namespace: monitoring}
spec:
  selector: {app: mailpit}
  ports:
    - {name: smtp, port: 1025}
    - {name: web, port: 8025}
EOF
kubectl apply -f mailpit.yaml
kubectl -n monitoring rollout status deploy/mailpit --timeout=120s
Expected:
deployment.apps/mailpit created
service/mailpit created
...
deployment "mailpit" successfully rolled out
Port 1025 accepts mails via SMTP, port 8025 shows them in the browser and via the API.
Save your progress? Sign up for free
Drill 2: Loki in single-binary mode
A single Loki process with the file system as storage is enough for three workers. You switch off everything the chart otherwise starts for large installations:
# on k0s-ctrl
helm repo add grafana https://grafana.github.io/helm-charts
helm repo update
cat > loki-werte.yaml <<'EOF'
deploymentMode: SingleBinary
loki:
  auth_enabled: false
  commonConfig: {replication_factor: 1}
  storage: {type: filesystem}
  schemaConfig:
    configs:
      - from: "2026-01-01"
        store: tsdb
        object_store: filesystem
        schema: v13
        index: {prefix: index_, period: 24h}
  limits_config: {retention_period: 48h}
  compactor:
    retention_enabled: true
    delete_request_store: filesystem
singleBinary:
  replicas: 1
  resources: {requests: {cpu: 50m, memory: 192Mi}}
  persistence: {size: 5Gi, storageClass: linstor-replicated}
read: {replicas: 0}
write: {replicas: 0}
backend: {replicas: 0}
gateway: {enabled: false}
chunksCache: {enabled: false}
resultsCache: {enabled: false}
lokiCanary: {enabled: false}
test: {enabled: false}
EOF
helm install loki grafana/loki --version 7.7.0 -n monitoring -f loki-werte.yaml \
  --wait --timeout 10m
kubectl -n monitoring get pod,pvc -l app.kubernetes.io/name=loki | cut -c1-80
Expected (abridged):
NAME         READY   STATUS    RESTARTS   AGE
pod/loki-0   2/2     Running   0          74s
NAME                                   STATUS   VOLUME
persistentvolumeclaim/storage-loki-0   Bound    pvc-fc406db6-...
retention_period: 48h only takes effect with
retention_enabled in the compactor – without it, Loki
deletes nothing. The second container in loki-0 is a
sidecar for rules; it does no harm.
Save your progress? Sign up for free
Drill 3: Alloy reads the journal
# on k0s-ctrl
cat > alloy-werte.yaml <<'EOF'
alloy:
  mounts:
    varlog: true
  resources: {requests: {cpu: 20m, memory: 64Mi}}
  configMap:
    content: |
      loki.relabel "journal" {
        forward_to = []
        rule {
          source_labels = ["__journal__systemd_unit"]
          target_label  = "unit"
        }
        rule {
          source_labels = ["__journal__transport"]
          target_label  = "transport"
        }
        rule {
          source_labels = ["__journal__hostname"]
          target_label  = "host"
        }
      }
      loki.source.journal "journal" {
        path          = "/var/log/journal"
        relabel_rules = loki.relabel.journal.rules
        labels        = {job = "journal"}
        max_age       = "12h"
        forward_to    = [loki.write.loki.receiver]
      }
      loki.write "loki" {
        endpoint {
          url = "http://loki.monitoring.svc:3100/loki/api/v1/push"
        }
      }
controller:
  type: daemonset
EOF
helm install alloy grafana/alloy --version 1.16.0 -n monitoring -f alloy-werte.yaml \
  --wait --timeout 5m
kubectl -n monitoring get pod -l app.kubernetes.io/name=alloy -o wide | cut -c1-70
Expected:
NAME          READY   STATUS    RESTARTS   AGE    IP            NODE
alloy-6nlqk   2/2     Running   0          104s   10.244.1.41   k0s-w2
alloy-7h4xc   2/2     Running   0          104s   10.244.0.48   k0s-w3
alloy-b242q   2/2     Running   0          104s   10.244.2.38   k0s-w1
varlog: true mounts the host’s /var/log,
which contains the journal. The relabel rules turn the journal fields
into the labels unit, transport and
host. Is anything arriving? Port-forward in a second
terminal:
# on k0s-ctrl
kubectl -n monitoring port-forward svc/loki 3100:3100
# on k0s-ctrl
curl -s localhost:3100/loki/api/v1/label/host/values | jq -c .data
curl -s localhost:3100/loki/api/v1/label/transport/values | jq -c .dataExpected:
["k0s-w1","k0s-w2","k0s-w3"]
["driver","journal","kernel","stdout","syslog"]
transport="kernel" are the kernel messages – that is
where DRBD speaks.
Save your progress? Sign up for free
Drill 4: Alerting rules
The rules go into the cluster as a PrometheusRule. All
of them carry team: storage; from Drill 6 on, Alertmanager
uses that label to route them to the mail:
# on k0s-ctrl
cat > regeln-linstor.yaml <<'EOF'
apiVersion: monitoring.coreos.com/v1
kind: PrometheusRule
metadata: {name: linstor-drbd, namespace: monitoring}
spec:
  groups:
    - name: linstor
      rules:
        - alert: LinstorControllerWeg
          expr: up{job="linstor-controller"} == 0
          for: 1m
          labels: {severity: critical, team: storage}
          annotations:
            summary: "LINSTOR-Controller über die VIP nicht erreichbar"
        - alert: LinstorSatelliteNichtOnline
          expr: linstor_node_state != 2
          for: 2m
          labels: {severity: warning, team: storage}
          annotations:
            summary: "Satellite {{ $labels.exported_node }} nicht ONLINE"
        - alert: LinstorPoolFastVoll
          expr: >-
            linstor_storage_pool_capacity_free_bytes{driver="LVM"}
            / linstor_storage_pool_capacity_total_bytes{driver="LVM"} < 0.2
          for: 10m
          labels: {severity: warning, team: storage}
          annotations:
            summary: "{{ $labels.exported_node }}/{{ $labels.storage_pool }} fast voll"
    - name: drbd
      rules:
        - alert: DrbdReactorWeg
          expr: up{job="linstor-node"} == 0
          for: 2m
          labels: {severity: warning, team: storage}
          annotations:
            summary: "drbd-reactor auf {{ $labels.instance }} nicht erreichbar"
        - alert: DrbdPrimaryOhneQuorum
          expr: >-
            drbd_device_quorum == 0 and on (instance, name)
            drbd_resource_role{drbd_resource_role="Primary"} == 1
          labels: {severity: critical, team: storage}
          annotations:
            summary: "{{ $labels.name }}: Primary {{ $labels.instance }} ohne Quorum"
        - alert: DrbdOhneQuorum
          expr: >-
            drbd_device_quorum == 0 unless on (instance, name)
            drbd_resource_role{drbd_resource_role="Primary"} == 1
          for: 1m
          labels: {severity: warning, team: storage}
          annotations:
            summary: "{{ $labels.name }}: Secondary {{ $labels.instance }} ohne Quorum"
        - alert: DrbdSuspendiert
          expr: >-
            drbd_resource_suspended == 1 and on (instance, name)
            drbd_resource_role{drbd_resource_role="Primary"} == 1
          for: 30s
          labels: {severity: critical, team: storage}
          annotations:
            summary: "{{ $labels.name }}: I/O auf {{ $labels.instance }} angehalten"
        - alert: DrbdVerbindungGestoert
          expr: drbd_connection_state{drbd_connection_state="Connected"} == 0
          for: 1m
          labels: {severity: warning, team: storage}
          annotations:
            summary: "{{ $labels.instance }}->{{ $labels.conn_name }} getrennt"
        - alert: DrbdPlatteAbgehaengt
          expr: drbd_device_unintentionaldiskless == 1
          labels: {severity: critical, team: storage}
          annotations:
            summary: "{{ $labels.name }}: Platte auf {{ $labels.instance }} weg"
EOF
The rule names and summaries are German, as in the lab; they show up exactly like this in the outputs, mails and screenshots below.
| Rule | Severity | Why |
|---|---|---|
DrbdPrimaryOhneQuorum |
critical | the application hangs or gets I/O errors |
DrbdOhneQuorum |
warning | Secondary without quorum: redundancy gone, data flows |
DrbdSuspendiert |
critical | only on the Primary – see Drill 7 |
LinstorSatelliteNichtOnline |
warning | no management, DRBD keeps running (Day 17) |
In English, the names read: LinstorControllerWeg
(controller gone), LinstorSatelliteNichtOnline (satellite
not online), LinstorPoolFastVoll (pool almost full),
DrbdReactorWeg (drbd-reactor gone),
DrbdPrimaryOhneQuorum (Primary without quorum),
DrbdOhneQuorum (DRBD without quorum),
DrbdSuspendiert (DRBD suspended),
DrbdVerbindungGestoert (connection disrupted),
DrbdPlatteAbgehaengt (disk detached).
and on (instance, name) joins two metrics by host and
resource: loss of quorum and Primary there.
unless is the counterpart.
Save your progress? Sign up for free
Drill 5: Testing rules with promtool
promtool ships with the Prometheus release, matching the
version in the cluster (3.16.0):
# on k0s-ctrl
ARCH=$(dpkg --print-architecture)
V=3.16.0
B=https://github.com/prometheus/prometheus/releases/download/v$V
curl -sSfLO $B/prometheus-$V.linux-$ARCH.tar.gz
curl -sSfL $B/sha256sums.txt | grep linux-$ARCH.tar.gz | sha256sum -c
tar xzf prometheus-$V.linux-$ARCH.tar.gz prometheus-$V.linux-$ARCH/promtool
sudo install prometheus-$V.linux-$ARCH/promtool /usr/local/bin/
sed -n '/^spec:/,$p' regeln-linstor.yaml | sed '1d;s/^  //' > regeln.yaml
promtool check rules regeln.yaml
Expected:
prometheus-3.16.0.linux-amd64.tar.gz: OK
Checking regeln.yaml
  SUCCESS: 9 rules found
The two sed commands cut out the spec: part
and remove its indentation – that is the format promtool
understands. Now the test: two replicas lose quorum at the same time,
k0s-w3 is Primary, k0s-w2 Secondary. On top of
that, a Secondary that reports suspended:
# on k0s-ctrl
cat > regeln-test.yaml <<'EOF'
rule_files: [regeln.yaml]
evaluation_interval: 30s
tests:
  - interval: 30s
    input_series:
      - series: drbd_device_quorum{instance="k0s-w3",name="a",volume="0"}
        values: 1 0 0 0 0 0
      - series: >-
          drbd_resource_role{instance="k0s-w3",name="a",drbd_resource_role="Primary"}
        values: 1 1 1 1 1 1
      - series: drbd_device_quorum{instance="k0s-w2",name="a",volume="0"}
        values: 1 0 0 0 0 0
      - series: >-
          drbd_resource_role{instance="k0s-w2",name="a",drbd_resource_role="Primary"}
        values: 0 0 0 0 0 0
    alert_rule_test:
      - eval_time: 30s
        alertname: DrbdPrimaryOhneQuorum
        exp_alerts:
          - exp_labels: {severity: critical, team: storage, instance: k0s-w3,
                         name: a, volume: "0"}
            exp_annotations: {summary: "a: Primary k0s-w3 ohne Quorum"}
      - eval_time: 1m
        alertname: DrbdOhneQuorum
        exp_alerts: []
      - eval_time: 2m
        alertname: DrbdOhneQuorum
        exp_alerts:
          - exp_labels: {severity: warning, team: storage, instance: k0s-w2,
                         name: a, volume: "0"}
            exp_annotations: {summary: "a: Secondary k0s-w2 ohne Quorum"}
  - interval: 30s
    input_series:
      - series: drbd_resource_suspended{instance="k0s-w1",name="a"}
        values: 1 1 1 1
      - series: >-
          drbd_resource_role{instance="k0s-w1",name="a",drbd_resource_role="Primary"}
        values: 0 0 0 0
    alert_rule_test:
      - eval_time: 1m
        alertname: DrbdSuspendiert
        exp_alerts: []
EOF
promtool test rules regeln-test.yaml
Expected:
Processing test file: regeln-test.yaml
  SUCCESS
The Primary triggers critical immediately, the Secondary
a warning only after for: 1m, and the Secondary with
suspended nothing at all. To see what a failure looks like,
change the second eval_time from 1m to
1m30s:
  FAILED:
    alertname: DrbdOhneQuorum, time: 1m30s,
        exp:[],
        got:[
            0:
              Labels:{alertname="DrbdOhneQuorum", instance="k0s-w2", name="a", sever...
Only when the test is green does the rule go into the cluster:
# on k0s-ctrl
kubectl apply -f regeln-linstor.yaml
Save your progress? Sign up for free
Drill 6: Alertmanager, Mailpit and Loki in Grafana
Both belong in the values of kps. A second values file
extends the one from Day 17:
# on k0s-ctrl
cat > kps-werte-18.yaml <<'EOF'
grafana:
  additionalDataSources:
    - {name: Loki, type: loki, uid: loki, url: "http://loki.monitoring.svc:3100"}
alertmanager:
  config:
    global:
      smtp_smarthost: mailpit.monitoring.svc:1025
      smtp_from: [email protected]
      smtp_require_tls: false
    route:
      receiver: "null"
      group_by: [alertname, instance]
      routes:
        - receiver: storage-mail
          matchers: [team = "storage"]
          group_wait: 30s
          group_interval: 2m
          repeat_interval: 4h
    receivers:
      - name: "null"
      - name: storage-mail
        email_configs:
          - to: [email protected]
            send_resolved: true
EOF
helm upgrade kps prometheus-community/kube-prometheus-stack --version 93.4.1 \
  -n monitoring -f ../tag17/kps-werte.yaml -f kps-werte-18.yaml --wait --timeout 10m
kubectl -n monitoring get secret alertmanager-kps-alertmanager-generated \
  -o jsonpath='{.data.alertmanager\.yaml\.gz}' | base64 -d | gunzip | sed -n 7,17p
Expected (abridged):
STATUS: deployed
REVISION: 2
route:
  receiver: "null"
  group_by:
  - alertname
  - instance
  routes:
  - receiver: storage-mail
    matchers:
    - team = "storage"
Only team: storage goes out by mail. The remaining rules
from kps (CPU, disks, Kubernetes) land at the receiver
null – in the lab, some of them fire constantly,
Watchdog even on purpose, and they would bury the lesson of
the day. They stay visible in Alertmanager.
Save your progress? Sign up for free
Drill 7: A real DRBD failure
To observe it, you need the port-forwards to Prometheus (9090, Day 17), Loki (3100), Alertmanager (9093) and Mailpit (8025), each in its own terminal:
# on k0s-ctrl
kubectl -n monitoring port-forward svc/kps-alertmanager 9093:9093
# on k0s-ctrl
kubectl -n monitoring port-forward svc/mailpit 8025:8025For the browser, you forward the ports through an SSH tunnel as on
Day 17, one -L each for 3000, 9093 and 8025.
Now you cut k0s-w1 off from DRBD traffic as on Day 6.
k0s-w1 holds Secondaries of linstor_db and of
the Prometheus volume:
# on k0s-w1
date +%T
sudo iptables -I INPUT -p tcp -m multiport --ports 7000:7999 -j DROP
sudo iptables -I OUTPUT -p tcp -m multiport --ports 7000:7999 -j DROP
sleep 10
sudo drbdadm status | grep -E '^[a-z]|quorum'
Expected (abridged):
05:30:00
linstor_db role:Secondary
  disk:UpToDate quorum:no open:no
pvc-571bd51f-... role:Secondary suspended:quorum
  disk:UpToDate quorum:no open:no blocked:upper
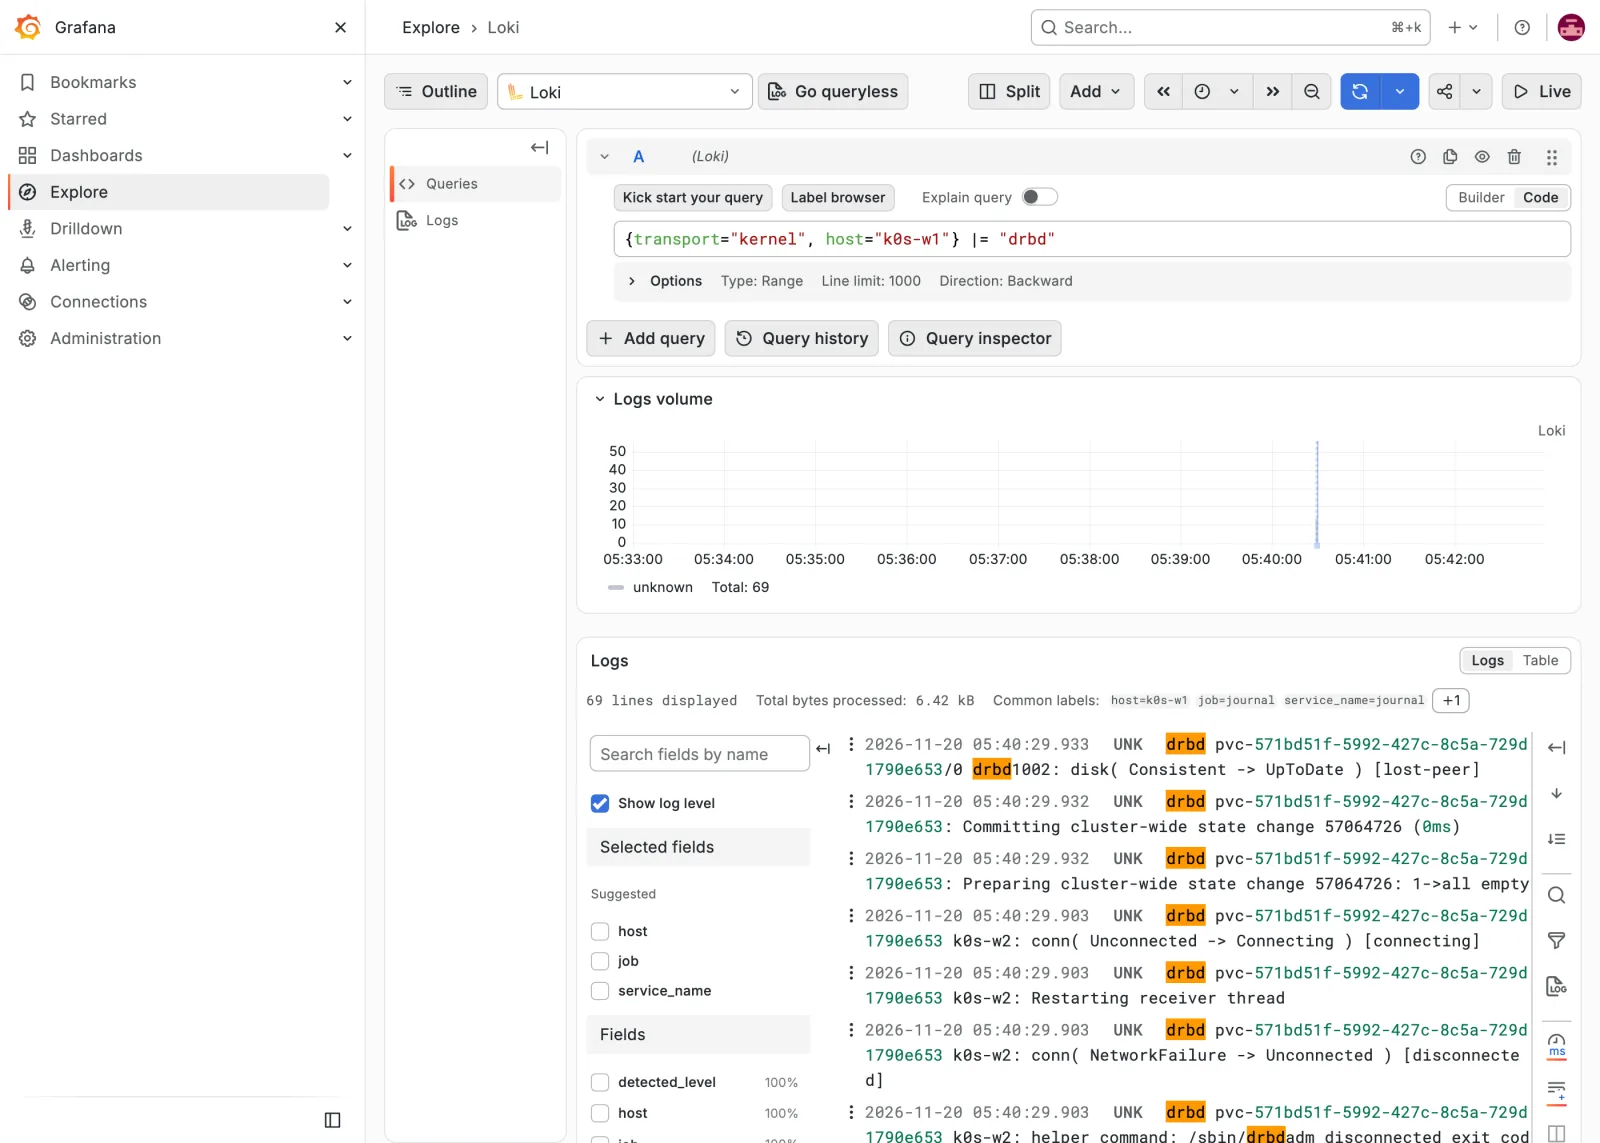
What does the kernel log say? Loki knows:
# on k0s-ctrl
curl -sG localhost:3100/loki/api/v1/query_range --data-urlencode 'since=10m' \
  --data-urlencode 'query={transport="kernel", host="k0s-w1"} |~ "PingAck|susp-io"' \
  | jq -r '.data.result[].values[][1]' | cut -c1-80
Expected (abridged):
...
drbd pvc-571bd51f-...: susp-io( no -> quorum )
drbd pvc-571bd51f-... k0s-ctrl: PingAck did not arrive i
drbd pvc-571bd51f-... k0s-w2: PingAck did not arrive in
drbd linstor_db k0s-w2: PingAck did not arrive in time.
drbd linstor_db k0s-ctrl: PingAck did not arrive in time.
drbd linstor_db k0s-w3: PingAck did not arrive in time.
...
The same in Grafana under Explore with the data source Loki:
After a good minute and a half, the rules fire:
# on k0s-ctrl
curl -s localhost:9090/api/v1/alerts | jq -r '.data.alerts[]
  | select(.labels.team=="storage")
  | "\(.labels.alertname) \(.labels.severity) \(.state) \(.annotations.summary)"' | sort
Expected (abridged):
DrbdOhneQuorum warning firing linstor_db: Secondary k0s-w1 ohne Quorum
DrbdOhneQuorum warning firing pvc-571bd51f-...: Secondary k0s-w1 ohne Quorum
DrbdVerbindungGestoert warning firing k0s-ctrl->k0s-w1 getrennt
...
DrbdVerbindungGestoert warning firing k0s-w2->k0s-w1 getrennt
DrbdVerbindungGestoert warning firing k0s-w3->k0s-w1 getrennt
Only warnings: redundancy is gone, data keeps flowing. No
DrbdSuspendiert, although pvc-571bd51f-... on
k0s-w1 shows suspended:quorum – DRBD also sets
susp-io on a Secondary without quorum; the application
notices nothing. The first version of the rule did not have the
condition “Primary” yet; in the lab it fired critical here
for exactly this Secondary. That is why Drill 4 contains the version
with and on (instance, name) and Drill 5 the test for
it.
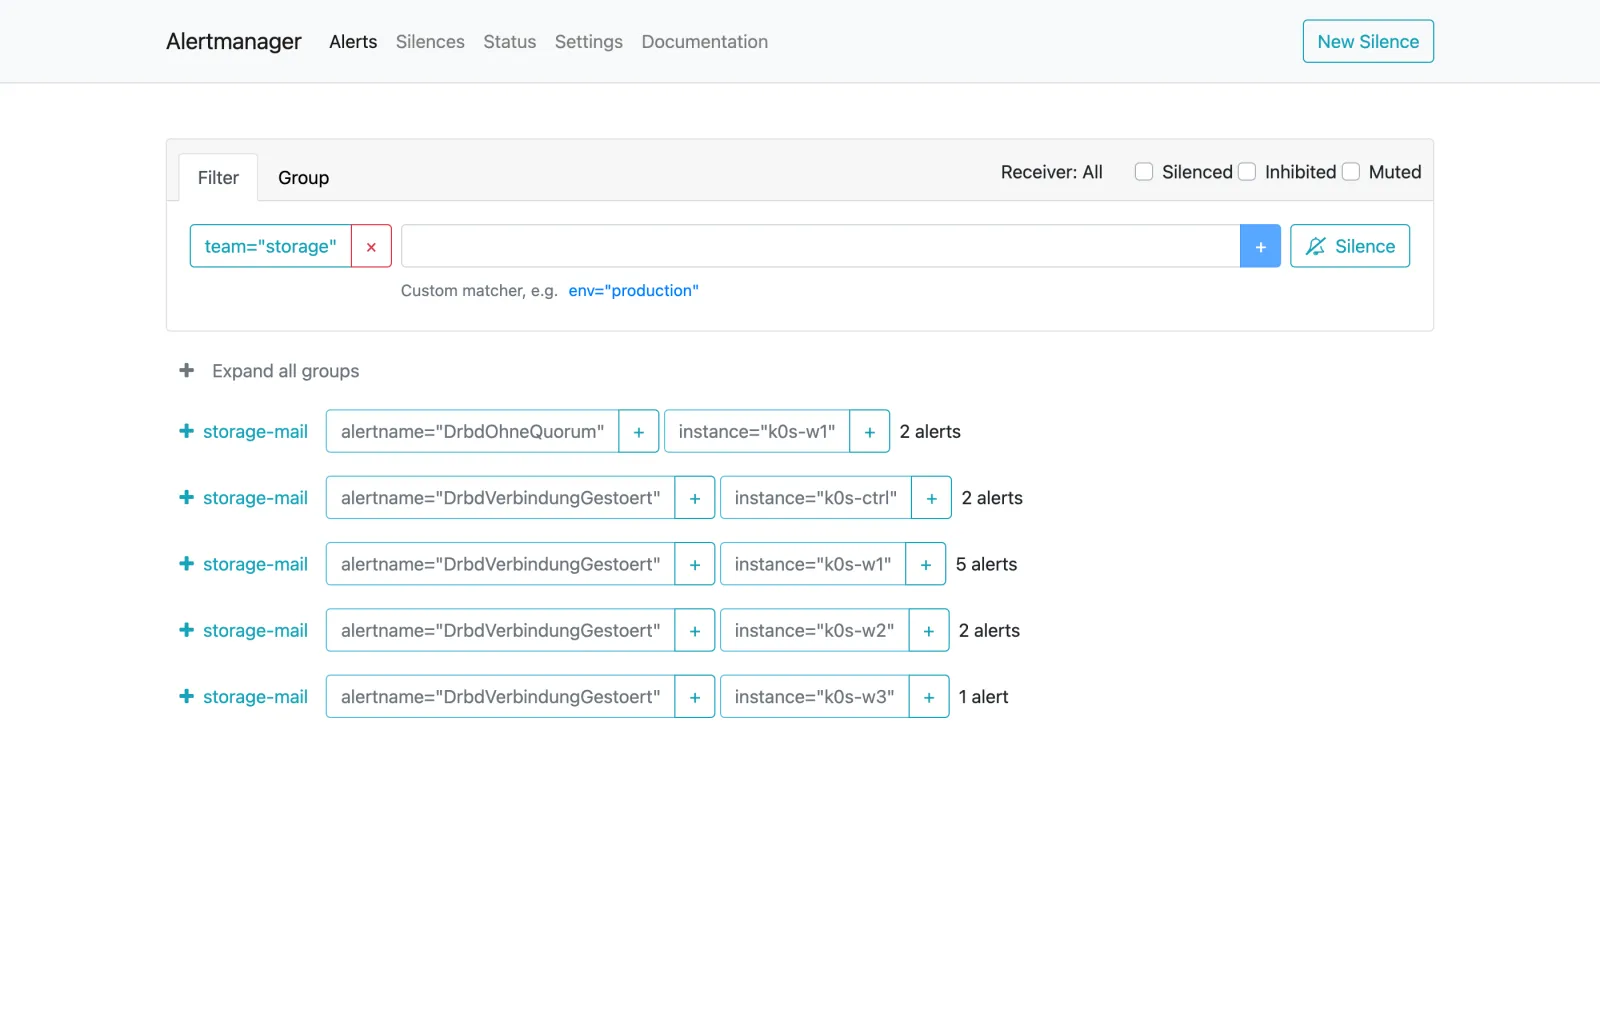
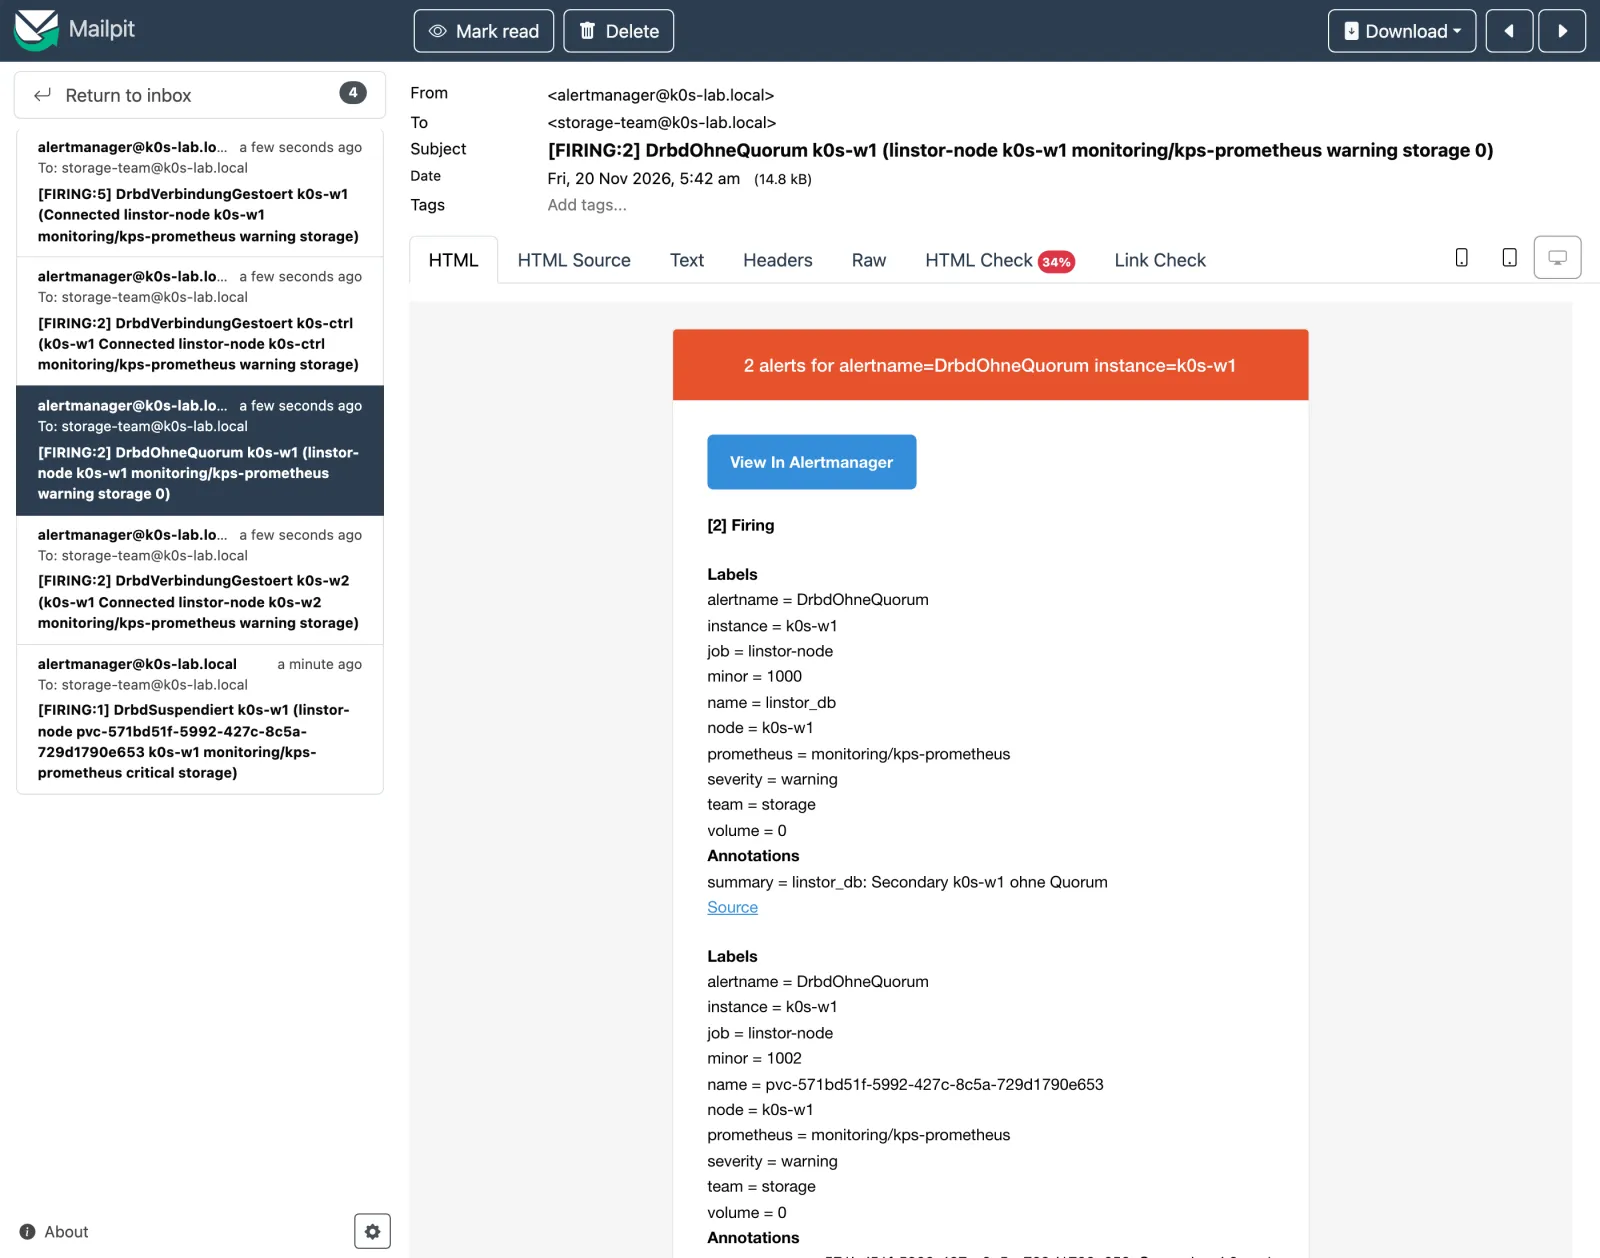
And the mails:
# on k0s-ctrl
curl -s localhost:8025/api/v1/messages | jq -r '.messages[] | .Subject[0:60]'
Expected (abridged):
[FIRING:1] DrbdVerbindungGestoert k0s-w3 (k0s-w1 Connected l
[FIRING:2] DrbdVerbindungGestoert k0s-ctrl (k0s-w1 Connected
[FIRING:5] DrbdVerbindungGestoert k0s-w1 (Connected linstor-
[FIRING:2] DrbdOhneQuorum k0s-w1 (linstor-node k0s-w1 monito
[FIRING:1] DrbdVerbindungGestoert k0s-w2 (k0s-w1 Connected l
One mail per rule and host (grouped by alertname and
instance). k0s-w3 has only one alert: it
shares only linstor_db with k0s-w1; the
Prometheus volume lives on k0s-w1 and k0s-w2.
Its mail arrives with the second wave half a minute later – if you look
too early, you will not find it yet.
Network back:
# on k0s-w1
sudo iptables -D INPUT -p tcp -m multiport --ports 7000:7999 -j DROP
sudo iptables -D OUTPUT -p tcp -m multiport --ports 7000:7999 -j DROP
sudo iptables -S | grep -c 7000
Expected: 0. After a minute, the
resolved notifications arrive:
# on k0s-ctrl
curl -s localhost:8025/api/v1/messages | jq -r '.messages[] | .Subject[0:60]' \
  | grep RESOLVED
Expected:
[RESOLVED] DrbdVerbindungGestoert k0s-ctrl (k0s-w1 Connected
[RESOLVED] DrbdVerbindungGestoert k0s-w3 (k0s-w1 Connected l
[RESOLVED] DrbdVerbindungGestoert k0s-w2 (k0s-w1 Connected l
[RESOLVED] DrbdOhneQuorum k0s-w1 (linstor-node k0s-w1 monito
[RESOLVED] DrbdVerbindungGestoert k0s-w1 (Connected linstor-| Time | Event |
|---|---|
| 05:30:00 | DRBD ports on k0s-w1 blocked |
| 05:30:03 | kernel: PingAck did not arrive in time, shortly after
susp-io( no -> quorum ) |
| 05:31:53 | first mails: quorum and connections of k0s-w1,
k0s-w2 (for: 1m) |
| 05:32:22 | second wave: k0s-ctrl and k0s-w3 (one
evaluation later, group_wait) |
| 05:33:17 | network back, 05:33:52 to 05:34:22 resolved notifications |
Save your progress? Sign up for free
Exercise: Speed Drills
- Show the last five DRBD kernel messages from
k0s-w2from Loki. Target time: 45 s - Show which rules Prometheus has loaded from the group
drbd. Target time: 30 s - Empty the Mailpit mailbox. Target time: 15 s
Solution
# on k0s-ctrl
curl -sG localhost:3100/loki/api/v1/query_range --data-urlencode 'limit=5' \
  --data-urlencode 'query={transport="kernel", host="k0s-w2"} |= "drbd"' \
  | jq -r '.data.result[].values[][1]' | cut -c1-60
curl -s localhost:9090/api/v1/rules | jq -r '.data.groups[]
  | select(.name=="drbd") | .rules[] | "\(.name) \(.health)"'
curl -s -X DELETE localhost:8025/api/v1/messages
Expected (abridged):
drbd linstor_db k0s-w1: Committing remote state change 34024
drbd linstor_db: Preparing remote state change 3402419172: 0
...
DrbdReactorWeg ok
DrbdPrimaryOhneQuorum ok
DrbdOhneQuorum ok
DrbdSuspendiert ok
DrbdVerbindungGestoert ok
DrbdPlatteAbgehaengt ok
ok
Save your progress? Sign up for free
Checkpoint
# on k0s-ctrl
kubectl -n monitoring get pod
Expected: kps Pods,
loki-0, three alloy-… and
mailpit-…, all Running.
# on k0s-ctrl
promtool test rules regeln-test.yaml
Expected: SUCCESS.
# on k0s-ctrl
curl -s localhost:9090/api/v1/alerts | jq -r '.data.alerts[]
  | select(.labels.team=="storage") | .labels.alertname'
Expected: no output – after the failure, everything is quiet again.
# on k0s-ctrl
linstor --no-utf8 --no-color resource list --faulty
Expected: an empty table.
Challenge
For planned maintenance on k0s-w1, the storage team
should not receive any mails. Create a silence for 30 minutes and test
it with the failure from Drill 7. Does really no mail arrive?
Hint: The other hosts also report a disrupted
connection – to k0s-w1.
Solution
A silence only on instance="k0s-w1" is not enough: in
the lab, three DrbdVerbindungGestoert mails still arrived
from k0s-ctrl, k0s-w2 and k0s-w3
– their connection to k0s-w1 is in the
label conn_name. Hence two silences:
# on k0s-ctrl
curl -s -X DELETE localhost:8025/api/v1/messages
kubectl -n monitoring exec alertmanager-kps-alertmanager-0 -c alertmanager -- \
  amtool --alertmanager.url=http://localhost:9093 silence add instance=k0s-w1 \
  --duration=30m --comment="Wartung k0s-w1"
kubectl -n monitoring exec alertmanager-kps-alertmanager-0 -c alertmanager -- \
  amtool --alertmanager.url=http://localhost:9093 silence add conn_name=k0s-w1 \
  --duration=30m --comment="Wartung k0s-w1"
Expected: two IDs,
e.g. 6a8ccbb9-88d0-4ac3-9dfb-d6a1e1f47ed4. Then set the
iptables rules from Drill 7 on k0s-w1 and wait
two minutes:
# on k0s-ctrl
curl -s 'localhost:9093/api/v2/alerts?silenced=true' | jq -r '.[]
  | select(.labels.team=="storage")
  | "\(.labels.alertname) \(.labels.instance) \(.status.state)"' | sort | uniq -c
curl -s localhost:8025/api/v1/messages | jq .total
Expected:
      2 DrbdOhneQuorum k0s-w1 suppressed
      2 DrbdVerbindungGestoert k0s-ctrl suppressed
      5 DrbdVerbindungGestoert k0s-w1 suppressed
      2 DrbdVerbindungGestoert k0s-w2 suppressed
      1 DrbdVerbindungGestoert k0s-w3 suppressed
0
All alerts are there, but suppressed, and the mailbox
stays empty. Remove the iptables rules on
k0s-w1 again (Drill 7) and end the silences after the
maintenance:
# on k0s-ctrl
kubectl -n monitoring exec alertmanager-kps-alertmanager-0 -c alertmanager -- \
  sh -c 'amtool --alertmanager.url=http://localhost:9093 silence query -q \
  | xargs amtool --alertmanager.url=http://localhost:9093 silence expire'
A silence that ends too early is harmless; a forgotten one swallows
the next real outage. That is why you always use
--duration.
Save your progress? Sign up for free
Interview Note
- Which DRBD alert wakes someone up at night? Loss of quorum or suspended I/O on the Primary, and a detached disk. A Secondary without quorum is a warning for working hours.
- How do you test alerting rules?
promtool test ruleswith made-up time series, also for the case where a rule must not fire. - Where do you look for the cause of a DRBD disconnect? In
the kernel log (
conn(,PingAck,susp-io), centrally in Loki across all hosts.
Enterprise Note
- Alertmanager with a real mail relay, chat or pager; routes by
severity (
critical→ on-call,warning→ ticket) and runbook links in the annotations. - Create maintenance windows as silences from the change process, not by hand.
- Alloy also on the witness and on hosts without the kubelet (systemd service); otherwise the kernel messages are missing exactly there.
- Loki with object storage (S3) and longer retention; logs of the storage hosts are evidence in case of data loss.
- Rules and tests in Git,
promtool test rulesin the pipeline before every rollout.