Day 7: karma
Goal: karma runs next to Alertmanager, shows all alerts as a dashboard and reads its settings from a file. You know the UI and the HTTP API behind it. · Duration: approx. 45 min · Prerequisite: Day 6
Briefing
- karma is a dashboard for Alertmanager, written in
Go and React, created at Cloudflare (formerly “unsee”). Project:
github.com/prymitive/karma. - karma queries the API v2 of one or more Alertmanagers at fixed intervals, merges the alerts and shows them as tiles. It does not change any alerts.
- karma can write only one thing: create, edit and expire silences. That happens either directly from the browser to Alertmanager or through karma as a proxy.
- karma is configured via a YAML file, environment variables or flags. For more than one Alertmanager, you need the file.
 Browser ──► karma :8000 ── every 30 s GET /api/v2/alerts/groups, /silences ──► alertmanager :9093
               │
               └── create silence (proxy: true) ── POST /api/v2/silences ──────►
Drill 1: The Quickest Way
One environment variable is enough to start with:
cd ~/am-lab
cat > dashboard.yaml <<'EOF'
services:
  karma:
    image: ghcr.io/prymitive/karma:v0.134
    environment:
      ALERTMANAGER_URI: http://alertmanager:9093
    ports:
      - "8000:8080"
EOF
echo "  - dashboard.yaml" >> compose.yaml
docker compose up -d karma
docker compose logs --no-log-prefix karma
Expected (shortened):
level=INFO msg="Version: v0.134"
level=INFO msg="Configured Alertmanager source" name=default cluster=default uri=http://alertmanager:9093 proxy=false readonly=false
level=INFO msg="Initial Alertmanager collection"
level=INFO msg="Upstream version" version=0.35.0 alertmanager=default
level=INFO msg="Got silences" alertmanager=default silences=3 duration=2.978019ms
level=INFO msg="Collected alert groups" alertmanager=default groups=2 duration=2.379345ms
level=INFO msg="Deduplicating alert groups" alertmanager=default groups=2
…
level=INFO msg="Starting HTTP server" address=[::]:8080- karma listens on 8080 inside the container. That port is already taken on the VM by notes-api, so karma is on 8000 outside.
- Before starting, karma fetches everything once. Only then does it accept requests.
- The upstream is called
defaultbecause you did not give it a name.
curl -s localhost:8000/health
curl -s localhost:8000/version
Expected:
Pong
{
  "version": "v0.134",
  "golang": "go1.27.3"
}
Save your progress? Sign up for free
Drill 2: The Configuration File
mkdir -p karma
cat > karma/karma.yaml <<'EOF'
karma:
  name: am-lab

alertmanager:
  interval: 30s
  servers:
    - name: prod
      uri: http://alertmanager:9093
      external_uri: http://172.16.0.61:9093
      timeout: 10s
      proxy: true

log:
  config: true
EOFkarma.nameappears in the title of the browser tab. With several karma instances, you know which one you are looking at.intervaldetermines how often karma queries all Alertmanagers, at most15m.uriis used by karma itself, so it is the name in the Compose network.external_uriis used by the browser for links into the Alertmanager UI. Use your VM address.proxy: true: the browser sends silences to karma, and karma passes them on. The browser then does not need to reach Alertmanager. On Day 11, the permission check needs this.log.config: truewrites the entire configuration to the log at startup, with all default values.
The Compose building block now reads the file:
cat > dashboard.yaml <<'EOF'
services:
  karma:
    image: ghcr.io/prymitive/karma:v0.134
    environment:
      CONFIG_FILE: /etc/karma/karma.yaml
    volumes:
      - ./karma:/etc/karma:ro
    ports:
      - "8000:8080"
EOF
docker compose up -d karma
docker compose logs --no-log-prefix karma | grep -A9 'msg=alertmanager:'
Expected:
level=INFO msg=alertmanager:
level=INFO msg="  interval: 30s"
level=INFO msg="  servers:"
level=INFO msg="    - cluster: \"\""
level=INFO msg="      name: prod"
level=INFO msg="      uri: http://alertmanager:9093"
level=INFO msg="      external_uri: http://172.16.0.61:9093"
level=INFO msg="      proxy_url: \"\""
level=INFO msg="      timeout: 10s"
level=INFO msg="      proxy: true"
karma has no reload. After every change to the file, you restart the
container: docker compose restart karma.
Save your progress? Sign up for free
Drill 3: Something to Look At
So that the dashboard is not empty, you create a few alerts. You already know the error rate and the node-exporter:
NOTES_ERROR_RATE=0.3 docker compose up -d notes-api
docker compose stop node-exporter
Plus test alerts that last three hours:
N=$(date -u +%Y-%m-%dT%H:%M:%SZ)
E=$(date -u -d '+3 hours' +%Y-%m-%dT%H:%M:%SZ)
amtool alert add alertname=PlatteVoll team=notes severity=warning instance=a \
  --annotation='summary="Platte a zu 91 % voll"' --start=$N --end=$E
amtool alert add alertname=PlatteVoll team=notes severity=warning instance=b \
  --annotation='summary="Platte b zu 92 % voll"' --start=$N --end=$E
amtool alert add alertname=PlatteVoll team=notes severity=warning instance=c \
  --annotation='summary="Platte c zu 95 % voll"' --start=$N --end=$E
amtool alert add alertname=Werbeaktion team=marketing severity=warning \
  --start=$N --end=$E
Tip: Did you take a break between two days? Test alerts live for three hours, the silences from Day 5 for two and 24 hours. If they are missing, create them again with the same commands, the silences as in Day 5 Drill 3 with
amtool silence add. The numbers in the next days will then match again.
Tried it: With
--endalone,amtool0.35 also sets the start to the end. The alert then hasstartsAtthree hours in the future and looks odd in karma. Always pass--startas well.
Prometheus needs a little over two minutes for the error rate. After
that, open http://172.16.0.61:8000 in your browser.
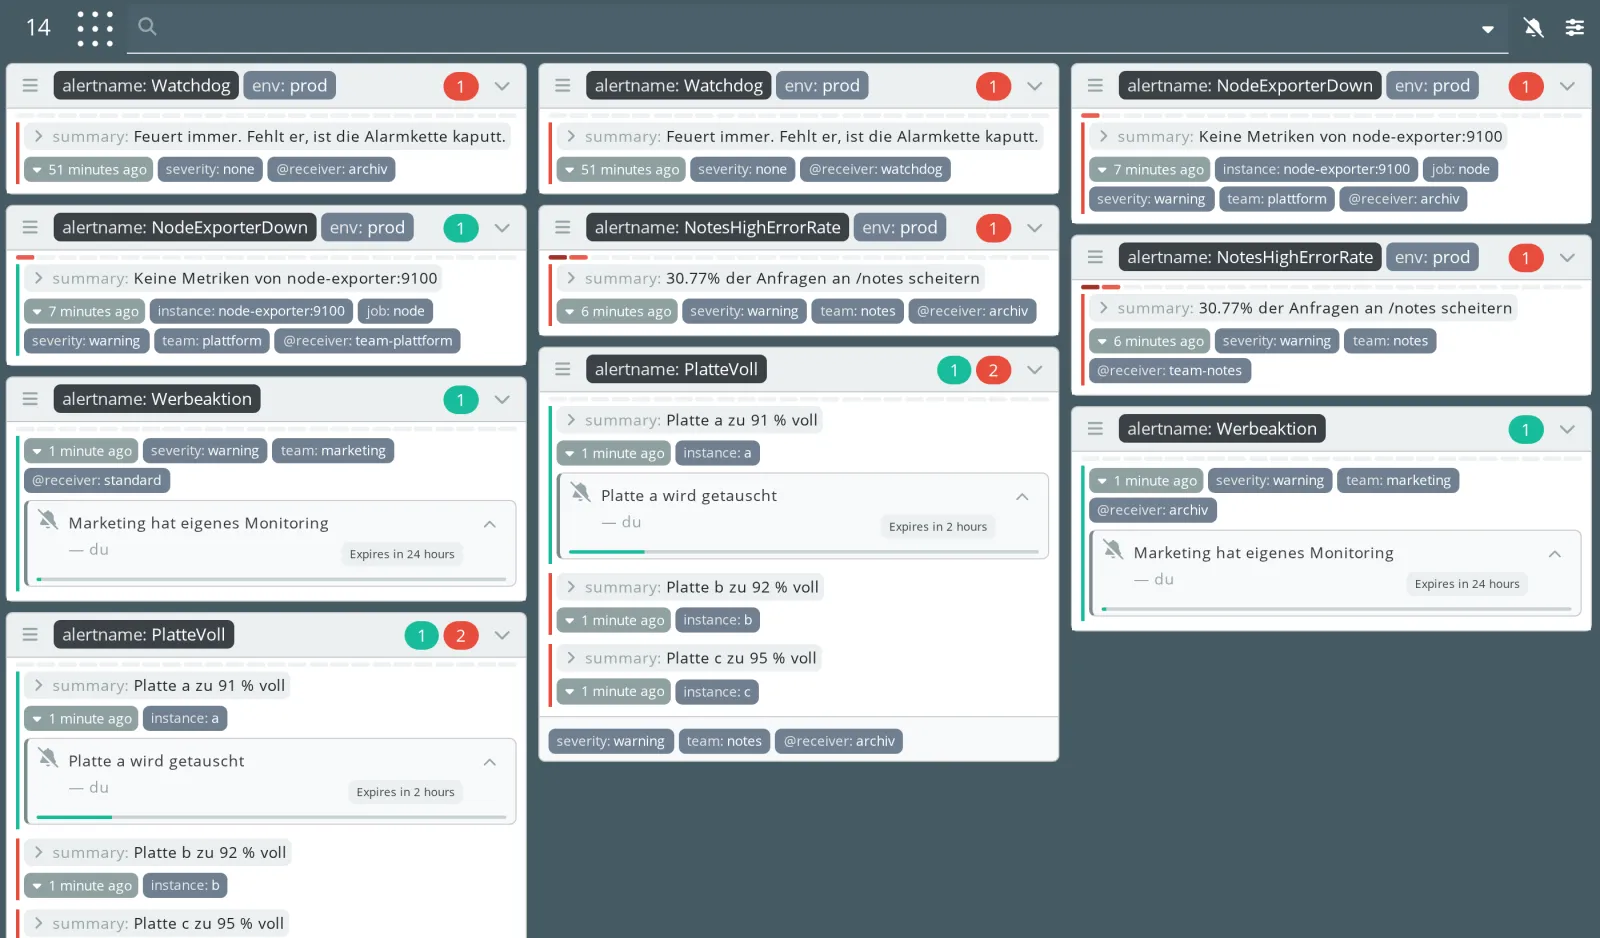
This is how you read the picture:
- Every tile is an alert group, the way Alertmanager
forms it. The title is made of the labels from
group_by, herealertnameandenv. - The numbers on the right of the title: red are
active alerts, green suppressed ones. For
PlatteVoll, two are active and one is muted. - Below each alert are its own labels. Labels that all alerts of a group share move into the footer of the tile.
- Silences appear directly on the alert, with comment, author and remaining time. The bar below shows how much of the duration has already passed.
- Labels with
@come from karma:@receiveris the receiver of the group,@statethe state, and later@alertmanagerthe upstream.
Two things stand out. Almost every group appears
twice, once with @receiver: archiv and
once with the team’s receiver. karma forms groups per receiver, and the
archive route from Day 3 gets everything. Also,
NodeExporterDown is green for team plattform: the
after-hours interval from Day 5 muted the group, and karma counts that
as suppressed. If you are reading this on a weekday before 6 p.m. or on
the weekend, it is red, and one suppressed alert is missing from the
counters in the next days. Day 8 takes care of both.
A click on the number at the top left opens the Overview: the most frequent values of every label across all alerts.
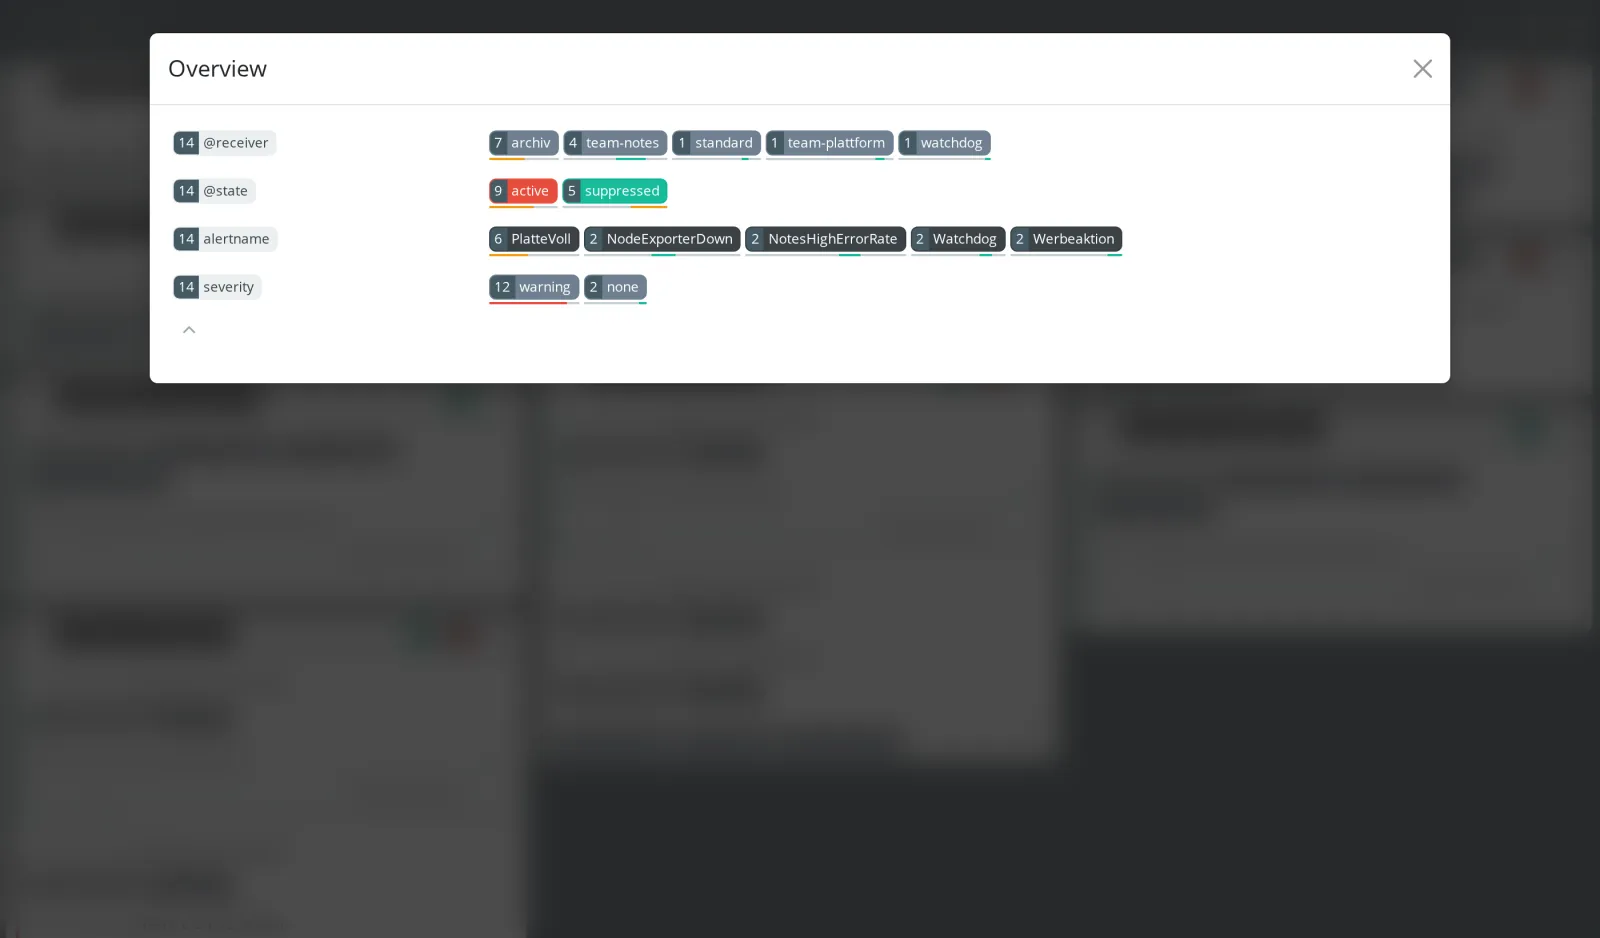
Here you see right away that the archive accounts for half of all entries. A click on a value sets it as a filter.
Save your progress? Sign up for free
Drill 4: The API Behind the UI
Everything the UI shows, karma also delivers as JSON. For checks from the command line, three endpoints are enough.
The names of all labels currently present:
curl -s localhost:8000/labelNames.json | jq -c .Expected:
["alertname","env","instance","job","severity","team"]The counters of the Overview:
curl -s localhost:8000/counters.json | jq '.total'Expected:
14The list of alerts, each as a list of its labels:
curl -s localhost:8000/alertList.json | jq -c '.alerts[0]'Expected:
[{"name":"alertname","value":"NodeExporterDown"},{"name":"env","value":"prod"},{"name":"instance","value":"node-exporter:9100"},{"name":"job","value":"node"},{"name":"severity","value":"warning"},{"name":"team","value":"plattform"}]The numbers from the API and the UI may differ for a moment. The UI fetches new data every 30 seconds, and karma itself also queries Alertmanager every 30 seconds.
Save your progress? Sign up for free
Checkpoint
curl -s localhost:8000/healthExpected: Pong.
docker compose logs --no-log-prefix karma | grep 'Configured Alertmanager'Expected: one line with name=prod and
proxy=true.
curl -s localhost:8000/labelNames.json | jq lengthExpected: 6; karma knows the labels of your alerts.
Challenge
Using only curl, find out which alerts are currently
suppressed and how often each name occurs.
Note: counters.json and
alertList.json take filters as the parameter
q, exactly like the search bar. The filter for the state is
called @state=suppressed.
curl -G --data-urlencode encodes it correctly.
Solution
curl -s -G localhost:8000/counters.json --data-urlencode 'q=@state=suppressed' \
  | jq -c '.counters[] | select(.name=="alertname") | .values[] | [.value, .hits]'
Expected:
["PlatteVoll",2]
["Werbeaktion",2]
["NodeExporterDown",1]
PlatteVoll (instance a) and Werbeaktion are
muted by the silences from Day 5, twice each, because both receivers
show them. NodeExporterDown once, only in the group of team
plattform with its after-hours interval. In the archive, it is
active.
Save your progress? Sign up for free
Enterprise Note
- karma only needs read access to the Alertmanager API. With
proxy: true, the users’ browsers do not need to reach Alertmanager at all. That is the better network boundary. - Set
external_urito the address that humans reach, that is the ingress or DNS name, not the internal service name. - Pin the image to a version (
v0.134), not tolatest. For karma,latestis the current state of the main branch, not the latest release. /healthalways answers withPong, even if no Alertmanager is reachable. Whether the upstreams are alive is shown by/metrics(Day 12).