Day 12: History, Health Checks and Troubleshooting
Goal: karma shows how often an alert came in the last 24 hours, warns when a Prometheus goes quiet, and is itself monitored by Prometheus. You check configurations before they bring karma down. · Duration: approx. 50 min · Prerequisite: Day 11
Briefing
- Alertmanager stores no history. Prometheus does: every alert leaves
behind the time series
ALERTS_FOR_STATE. karma queries it for every group and shows 24 blocks, one per hour. The darker, the more often the alert came. - Which Prometheus karma asks is stated in every alert: in
generatorURL. If the address is not reachable from karma, rewrite changes it. - A health check is a filter that must always find something, typically the Watchdog. If it finds nothing, the chain Prometheus → Alertmanager is broken, and karma shows an error.
- karma has its own metrics at
/metrics. The most important one:karma_alertmanager_up.
Drill 1: The History
The history is switched on by default. You have already seen it: the row of small blocks at the top of every tile. Gray blocks are quiet hours, colored ones are hours with alerts, and the darker, the more often.
You can send the query behind it yourself:
cd ~/am-lab
curl -s -u alice:lab-karma-pw-123 -X POST -H 'Content-Type: application/json' \
  -d '{"labels":{"alertname":"NotesApiDown"},"sources":["http://172.16.0.61:9090"]}' \
  localhost:8000/history.json | jq -c '{error, stunden: (.samples|length)}'
Expected:
{"error":"","stunden":24}sourcesis the address fromgeneratorURL, that is--web.external-urlfrom Day 1.- karma only reaches
172.16.0.61:9090here because the port is open on the VM. In a real network, the public address of Prometheus is often not the same as the internal one.
That is why you redirect karma to the internal names. Append to
karma/karma.yaml:
cat >> karma/karma.yaml <<'EOF'

history:
  enabled: true
  rewrite:
    - source: 'http://172.16.0.61:9090'
      uri: 'http://prometheus:9090'
    - source: 'http://172.16.0.61:9091'
      uri: 'http://prometheus-dev:9090'
EOF
Before you restart, check the file with karma itself:
docker run --rm -v $PWD/karma:/etc/karma:ro ghcr.io/prymitive/karma:v0.134 \
  --config.file /etc/karma/karma.yaml --check-config 2>&1 | tail -1
Expected:
level=INFO msg="Configuration is valid"--check-config reads the file, the ACLs and all regexes,
and exits. A typo shows up here, not only when karma no longer
starts.
To see that the redirect takes effect, set the log to
debug briefly. The log section in
karma/karma.yaml gets one more line:
log:
  config: true
  level: debug
docker compose restart karma
curl -s -u alice:lab-karma-pw-123 -X POST -H 'Content-Type: application/json' \
-d '{"labels":{"alertname":"NotesApiDown"},"sources":["http://172.16.0.61:9090"]}' \
localhost:8000/history.json > /dev/null
docker compose logs --no-log-prefix --since 30s karma | grep -E 'rewrite|count query'Expected (wrapped):
level=DEBUG msg="Alert history source rewrite" source=http://172.16.0.61:9090
  uri=http://prometheus:9090
level=DEBUG msg="Send alert count query" uri=http://prometheus:9090
  labels="map[alertname:NotesApiDown]"
  query="changes(ALERTS_FOR_STATE{alertname=\"NotesApiDown\"}[1h])" timeout=20s
The PromQL query counts how often ALERTS_FOR_STATE
changed per hour, that is how often the alert started anew. An alert
that has been firing continuously for hours therefore has only one red
block. Remove the level: debug line again afterwards; the
debug log is very chatty.
Save your progress? Sign up for free
Drill 2: The Watchdog as a Health Check
Every upstream gets a filter that must find the Watchdog of its
environment. For the three prod nodes, add this under each server in
karma/karma.yaml:
      healthcheck:
        filters:
          prometheus-prod:
            - alertname=Watchdog
            - env=prod
And under dev:
      healthcheck:
        filters:
          prometheus-dev:
            - alertname=Watchdog
            - env=dev
The name (prometheus-prod) appears in the error message.
All filters in a list must match at the same time.
docker run --rm -v $PWD/karma:/etc/karma:ro ghcr.io/prymitive/karma:v0.134 \
  --config.file /etc/karma/karma.yaml --check-config 2>&1 | tail -1
docker compose restart karma
curl -s -u alice:lab-karma-pw-123 -G localhost:8000/counters.json \
  --data-urlencode 'q=alertname=Watchdog' | jq .total
Expected:
level=INFO msg="Configuration is valid"
0
The Watchdog has disappeared from the view. karma hides alerts that a
health check finds (healthcheck.visible: false is the
default). They have their job; nobody needs to look at them.
Now the dev Prometheus fails:
docker compose stop prometheus-devThe Watchdog does not disappear immediately. When Prometheus last sent it, it gave it an expiry date four minutes in the future:
amtool alert query alertname=Watchdog --alertmanager.url=http://localhost:9096 -o json \
  | jq -r '.[0].endsAt'
Expected (four minutes after stopping):
2026-11-16T20:59:33.799ZAfter that, at karma’s next fetch:
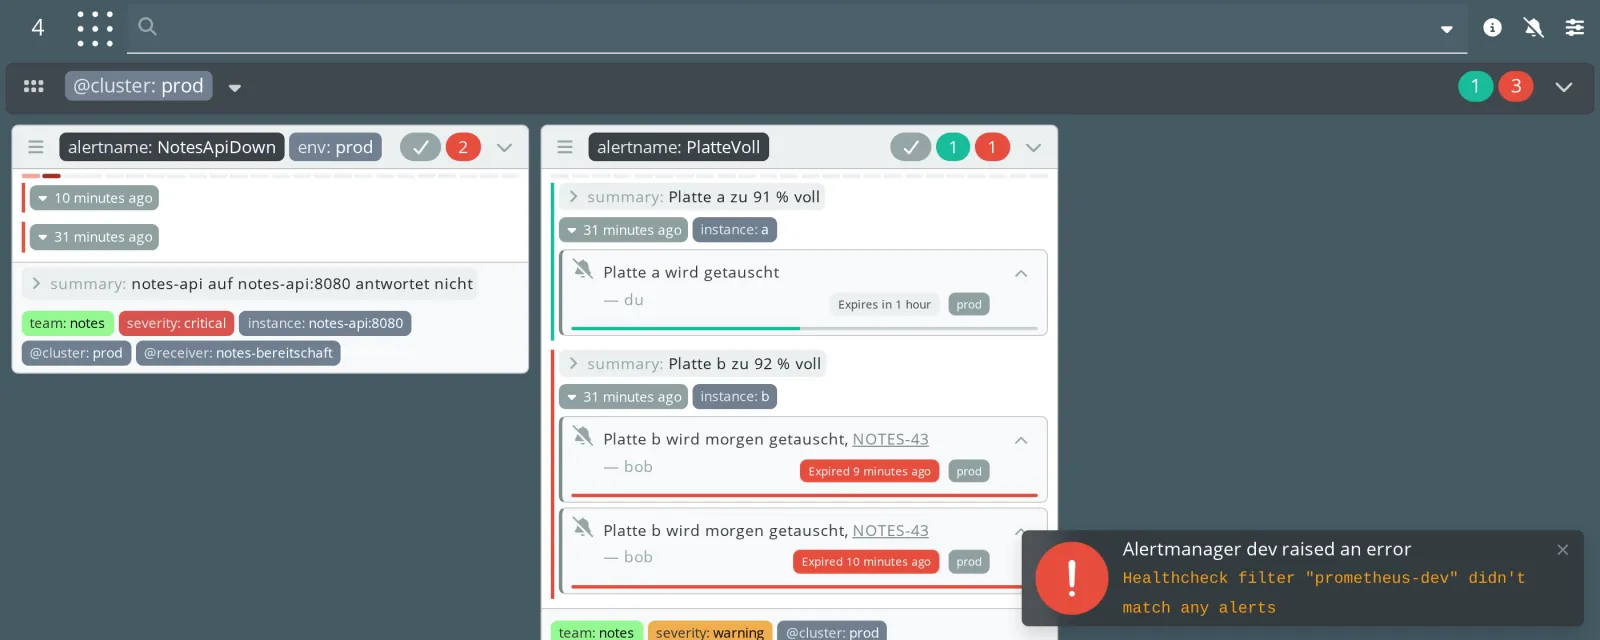
- At the bottom right:
Healthcheck filter "prometheus-dev" didn't match any alerts. - The dev grid has disappeared completely. karma treats the upstream as failed.
- The info icon stays at the top right as long as an error exists.
curl -s -u alice:lab-karma-pw-123 localhost:8000/metrics | grep '^karma_alertmanager_up'Expected:
karma_alertmanager_up{alertmanager="dev"} 0
karma_alertmanager_up{alertmanager="prod-1"} 1
karma_alertmanager_up{alertmanager="prod-2"} 1
karma_alertmanager_up{alertmanager="prod-3"} 1
The dev Alertmanager is running, but for karma it is 0
because its Watchdog is missing. That is exactly what you want: an
Alertmanager without alerts is not a healthy Alertmanager.
docker compose start prometheus-devSave your progress? Sign up for free
Drill 3: What karma Reveals About Itself
All of karma’s own metrics:
curl -s -u alice:lab-karma-pw-123 localhost:8000/metrics | grep '^karma_' \
  | cut -d'{' -f1 | cut -d' ' -f1 | sort -u
Expected:
karma_alertmanager_errors_total
karma_alertmanager_up
karma_collect_cycles_total
karma_collected_alerts_count
karma_collected_groups_countkarma_alertmanager_up: 1 or 0 per upstream, including the health check.karma_alertmanager_errors_total: errors while fetching, separated intoalertsandsilences.karma_collect_cycles_total: grows every 30 seconds. If the value stands still, karma is hanging.
More help with troubleshooting:
Flag in log |
Effect |
|---|---|
config: true |
whole configuration to the log at startup |
level: debug |
every query to Alertmanager and Prometheus |
requests: true |
every HTTP request to karma |
format: json |
one JSON object per line, for Loki and co. |
Save your progress? Sign up for free
Checkpoint
curl -s -u alice:lab-karma-pw-123 localhost:8000/metrics | grep -c '^karma_alertmanager_up.* 1$'Expected: 4, after the dev Prometheus is running again
and its Watchdog is back.
docker compose logs --no-log-prefix karma | grep -c 'healthcheck:'Expected: a number greater than 0; the health checks are in the configuration.
docker run --rm -v $PWD/karma:/etc/karma:ro ghcr.io/prymitive/karma:v0.134 \
  --config.file /etc/karma/karma.yaml --check-config 2>&1 | tail -1
Expected: Configuration is valid.
Challenge
karma sees the error, but only those who happen to be looking. Have Prometheus scrape karma and alert when an upstream is missing for more than two minutes. Test with the dev Alertmanager.
Note: Prometheus reaches karma directly in the
Compose network at karma:8080, without Caddy. With header
auth, /metrics is reachable without the header; all other
paths are not.
Solution
In prometheus/prometheus.yml under
scrape_configs, a fourth job:
  - job_name: karma
    static_configs:
      - targets: ["karma:8080"]
Append a rule to prometheus/rules/plattform.yml:
cat >> prometheus/rules/plattform.yml <<'EOF'
      - alert: KarmaUpstreamDown
        expr: karma_alertmanager_up == 0
        for: 2m
        labels:
          severity: warning
          team: plattform
        annotations:
          summary: "karma erreicht Alertmanager {{ $labels.alertmanager }} nicht"
EOF
promtool check rules prometheus/rules/plattform.yml
curl -s -X POST localhost:9090/-/reload
Expected:
Checking prometheus/rules/plattform.yml
  SUCCESS: 4 rules found
promtool query instant http://localhost:9090 karma_alertmanager_upExpected (after one scrape):
karma_alertmanager_up{alertmanager="dev", instance="karma:8080", job="karma"} => 1 @[1794863199.252]
karma_alertmanager_up{alertmanager="prod-1", instance="karma:8080", job="karma"} => 1 @[1794863199.252]
…
docker compose stop alertmanager-devAfter a little over three minutes:
promtool query instant http://localhost:9090 'ALERTS{alertname="KarmaUpstreamDown"}'Expected:
ALERTS{alertmanager="dev", alertname="KarmaUpstreamDown", alertstate="firing", instance="karma:8080", job="karma", severity="warning", team="plattform"} => 1 @[1794863400.787]docker compose start alertmanager-devThis alert runs through the prod Alertmanager. If prod fails, it does not help. That is why Alertmanager is additionally monitored from outside, for example with a dead man’s switch on the Watchdog.
Save your progress? Sign up for free
Enterprise Note
- Send the Watchdog to an external service (Healthchecks.io, Dead Man’s Snitch, PagerDuty heartbeat). If it stops arriving, the service raises the alarm, independently of your own chain.
- You almost always need
history.rewriteas soon as Prometheus sits behind an ingress with login. Headers and TLS are available per rule. - Put
--check-configin CI, right next topromtoolandamtool check-config. - Without
level: debug, karma is very quiet. For production,infowithformat: jsonis enough.