Day 13: karma on Kubernetes
Goal: kube-prometheus-stack runs on k3s with two Alertmanagers, plus karma as a Deployment with a ConfigMap. Your own
PrometheusRulereports a broken pod, and you clear away the false alerts that k3s produces. · Duration: approx. 75 min · Prerequisite: Day 12
Briefing
- kube-prometheus-stack (kps for short) is a Helm chart with the Prometheus Operator, Prometheus, Alertmanager, node-exporter, kube-state-metrics and around 150 ready-made rules for Kubernetes.
- The operator knows its own objects:
PrometheusRulefor rules,ServiceMonitorfor scrapes,AlertmanagerConfigfor routes. It builds the configuration files from them. - There is no maintained official Helm chart for karma. A Deployment with a ConfigMap is quickly written anyway.
- Alertmanager runs as a StatefulSet. Every pod has a fixed DNS name
via the headless Service
alertmanager-operated. That is exactly what karma needs.
 Namespace monitoring                                        Namespace lab
 ├─ prometheus-kps-prometheus-0   :30090 ── rules ───────────── kaputt (CrashLoop)
 ├─ alertmanager-kps-alertmanager-0 ┐                          PrometheusRule lab
 ├─ alertmanager-kps-alertmanager-1 ┴── karma :30800
Drill 1: Make Room, k3s, Helm
kps needs a good 1.5 GB of memory. Stop the Compose project. With 4 GB this is necessary; with 8 GB it spares the VM. It is preserved and comes back in Day 14:
cd ~/am-lab
docker compose stop
curl -sfL https://get.k3s.io | INSTALL_K3S_VERSION=v1.37.2+k3s1 \
sh -s - --disable traefik --disable servicelb
mkdir -p ~/.kube
sudo cp /etc/rancher/k3s/k3s.yaml ~/.kube/config
sudo chown "$(id -u):$(id -g)" ~/.kube/config
chmod 600 ~/.kube/config
echo 'export KUBECONFIG=~/.kube/config' >> ~/.bashrc
export KUBECONFIG=~/.kube/config
kubectl get nodesExpected:
NAME    STATUS   ROLES           AGE   VERSION
karma   Ready    control-plane   18s   v1.37.2+k3s1
--disable traefik --disable servicelb: no ingress, no load balancer. Everything runs via NodePorts.- Without
KUBECONFIG, the k3skubectlalways reads/etc/rancher/k3s/k3s.yamland fails because of the permissions.
Helm comes as a single file:
curl -fsSLO https://get.helm.sh/helm-v4.3.2-linux-amd64.tar.gz
tar xzf helm-v4.3.2-linux-amd64.tar.gz
mv linux-amd64/helm ~/.local/bin/
rm -r linux-amd64 helm-v4.3.2-linux-amd64.tar.gz
helm version --short
Expected:
v4.3.2+g8346aaaSave your progress? Sign up for free
Drill 2: kube-prometheus-stack
mkdir -p ~/am-lab/k8s
cd ~/am-lab/k8s
cat > kps-values.yaml <<'EOF'
fullnameOverride: kps

grafana:
  enabled: false

prometheus:
  service:
    type: NodePort
    nodePort: 30090
  prometheusSpec:
    externalUrl: http://172.16.0.61:30090
    retention: 2d
    ruleSelectorNilUsesHelmValues: false

alertmanager:
  service:
    type: NodePort
    nodePort: 30093
  alertmanagerSpec:
    replicas: 2
    externalUrl: http://172.16.0.61:30093
EOF
fullnameOverride: kpskeeps the names short. Without it, the first Alertmanager pod is calledalertmanager-kps-kube-prometheus-stack-alertmanager-0.- You do not need Grafana here. That saves memory.
ruleSelectorNilUsesHelmValues: false: Prometheus loads everyPrometheusRulein the cluster. Otherwise only those with the labelrelease: kps.replicas: 2: two Alertmanagers in the cluster. The operator sets up gossip itself.externalUrl: the same job as--web.external-urlin Day 1.
helm repo add prometheus-community https://prometheus-community.github.io/helm-charts
helm upgrade --install kps prometheus-community/kube-prometheus-stack \
  --version 93.3.0 -n monitoring --create-namespace -f kps-values.yaml --wait
kubectl -n monitoring get pods
Expected:
NAME                                     READY   STATUS    RESTARTS   AGE
alertmanager-kps-alertmanager-0          2/2     Running   0          21s
alertmanager-kps-alertmanager-1          2/2     Running   0          21s
kps-kube-state-metrics-dc46747f8-5k8vr   1/1     Running   0          26s
kps-operator-7988b8464d-p9wng            1/1     Running   0          26s
kps-prometheus-node-exporter-xp2n6       1/1     Running   0          26s
prometheus-kps-prometheus-0              2/2     Running   0          19s
The second container in every Alertmanager pod is the
config-reloader. It reloads the configuration when the
operator changes it.
Save your progress? Sign up for free
Drill 3: karma as a Deployment
One file with ConfigMap, Deployment and Service:
cat > karma.yaml <<'EOF'
apiVersion: v1
kind: ConfigMap
metadata:
  name: karma
  namespace: monitoring
data:
  karma.yaml: |
    karma:
      name: k3s
    alertmanager:
      interval: 30s
      servers:
        - name: k3s-0
          cluster: k3s
          uri: http://alertmanager-kps-alertmanager-0.alertmanager-operated:9093
          external_uri: http://172.16.0.61:30093
          proxy: true
          healthcheck:
            filters:
              watchdog:
                - alertname=Watchdog
        - name: k3s-1
          cluster: k3s
          uri: http://alertmanager-kps-alertmanager-1.alertmanager-operated:9093
          external_uri: http://172.16.0.61:30093
          proxy: true
          healthcheck:
            filters:
              watchdog:
                - alertname=Watchdog
    history:
      rewrite:
        - source: 'http://172.16.0.61:30090'
          uri: 'http://kps-prometheus:9090'
    labels:
      strip: [prometheus, endpoint, service]
    ui:
      multiGridLabel: namespace
---
apiVersion: apps/v1
kind: Deployment
metadata:
  name: karma
  namespace: monitoring
spec:
  replicas: 1
  selector:
    matchLabels:
      app: karma
  template:
    metadata:
      labels:
        app: karma
    spec:
      containers:
        - name: karma
          image: ghcr.io/prymitive/karma:v0.134
          env:
            - name: CONFIG_FILE
              value: /etc/karma/karma.yaml
          ports:
            - containerPort: 8080
          readinessProbe:
            httpGet:
              path: /health
              port: 8080
          resources:
            requests:
              memory: 64Mi
            limits:
              memory: 256Mi
          volumeMounts:
            - name: config
              mountPath: /etc/karma
      volumes:
        - name: config
          configMap:
            name: karma
---
apiVersion: v1
kind: Service
metadata:
  name: karma
  namespace: monitoring
spec:
  type: NodePort
  selector:
    app: karma
  ports:
    - port: 8080
      nodePort: 30800
EOF
kubectl apply -f karma.yaml
kubectl -n monitoring rollout status deploy/karma
kubectl -n monitoring logs deploy/karma | grep -E 'Configured|Upstream version'
Expected:
configmap/karma created
deployment.apps/karma created
service/karma created
deployment "karma" successfully rolled out
level=INFO msg="Configured Alertmanager source" name=k3s-0 cluster=k3s uri=http://alertmanager-kps-alertmanager-0.alertmanager-operated:9093 proxy=true readonly=false
level=INFO msg="Configured Alertmanager source" name=k3s-1 cluster=k3s uri=http://alertmanager-kps-alertmanager-1.alertmanager-operated:9093 proxy=true readonly=false
level=INFO msg="Upstream version" version=0.35.0 alertmanager=k3s-0
level=INFO msg="Upstream version" version=0.35.0 alertmanager=k3s-1<pod>.alertmanager-operatedis the DNS name of a single pod in the StatefulSet. The normal Servicekps-alertmanagerwould distribute the requests across both pods, and karma would alternately see one or the other.labels.striphides labels that the operator attaches to every alert./healthas the readiness probe: karma only answers after the first fetch.- karma reads the ConfigMap only at startup. After a change:
kubectl -n monitoring rollout restart deploy/karma.
After half a minute:
curl -s localhost:30800/metrics | grep '^karma_alertmanager_up'Expected:
karma_alertmanager_up{alertmanager="k3s-0"} 1
karma_alertmanager_up{alertmanager="k3s-1"} 1
Both at 1. The kps Watchdog is there, and the health check is satisfied.
Save your progress? Sign up for free
Drill 4: Your Own Rule
A pod that never starts, and a rule for it, both in the namespace
lab:
cat > lab.yaml <<'EOF'
apiVersion: v1
kind: Namespace
metadata:
  name: lab
---
apiVersion: apps/v1
kind: Deployment
metadata:
  name: kaputt
  namespace: lab
spec:
  replicas: 1
  selector:
    matchLabels:
      app: kaputt
  template:
    metadata:
      labels:
        app: kaputt
    spec:
      containers:
        - name: kaputt
          image: busybox:1.37
          command: ["sh", "-c", "echo Konfiguration fehlt; exit 1"]
---
apiVersion: monitoring.coreos.com/v1
kind: PrometheusRule
metadata:
  name: lab
  namespace: lab
spec:
  groups:
    - name: lab
      rules:
        - alert: LabPodCrashLoop
          expr: max_over_time(kube_pod_container_status_waiting_reason{namespace="lab", reason="CrashLoopBackOff"}[5m]) >= 1
          for: 1m
          labels:
            severity: warning
            team: notes
          annotations:
            summary: "{{ $labels.pod }} hängt im CrashLoopBackOff"
EOF
kubectl apply -f lab.yamlkube_pod_container_status_waiting_reasoncomes from kube-state-metrics. The value is 1 as long as a container is waiting with this reason.max_over_time(…[5m])smooths over the gaps. Between two restarts, the container briefly waits with a different reason.
Tried it: With
… == 1withoutmax_over_time, the alert kept switching off and on in the test, and karma sometimes showed it and sometimes did not. The first version withincrease(…restarts_total[5m]) > 2never fired. In CrashLoopBackOff, Kubernetes eventually restarts the pod only every five minutes.
After a little over two minutes:
curl -s localhost:30090/api/v1/rules \
  | jq -r '.data.groups[] | select(.name=="lab") | .rules[] | "\(.name) \(.state)"'
Expected:
LabPodCrashLoop firingSave your progress? Sign up for free
Drill 5: Groups in kps
Open http://172.16.0.61:30800. All alerts from
lab are in one tile without a title. The
default route of kps groups only by namespace:
curl -s localhost:30093/api/v2/status | jq -r .config.original | grep -A2 group_byExpected:
  group_by:
  - namespace
  continue: false
And namespace is also the label of the grid. Nothing is
left for the title. In kps-values.yaml, add under
alertmanager (same indentation as
alertmanagerSpec):
  config:
    route:
      group_by: [namespace, alertname]
helm upgrade kps prometheus-community/kube-prometheus-stack \
--version 93.3.0 -n monitoring -f kps-values.yaml --waitAfter about a minute, the config-reloader has loaded the
new configuration:
curl -s localhost:30093/api/v2/status | jq -r .config.original | grep -A3 group_byExpected:
group_by:
- namespace
- alertname
continue: falseHelm merges the values with those of the chart. Receivers, the
Watchdog route and the inhibit rules of kps stay; only
group_by is new.
Save your progress? Sign up for free
Checkpoint
kubectl -n monitoring get statefulset alertmanager-kps-alertmanagerExpected: READY 2/2.
curl -s localhost:30800/metrics | grep -c '^karma_alertmanager_up.* 1$'Expected: 2.
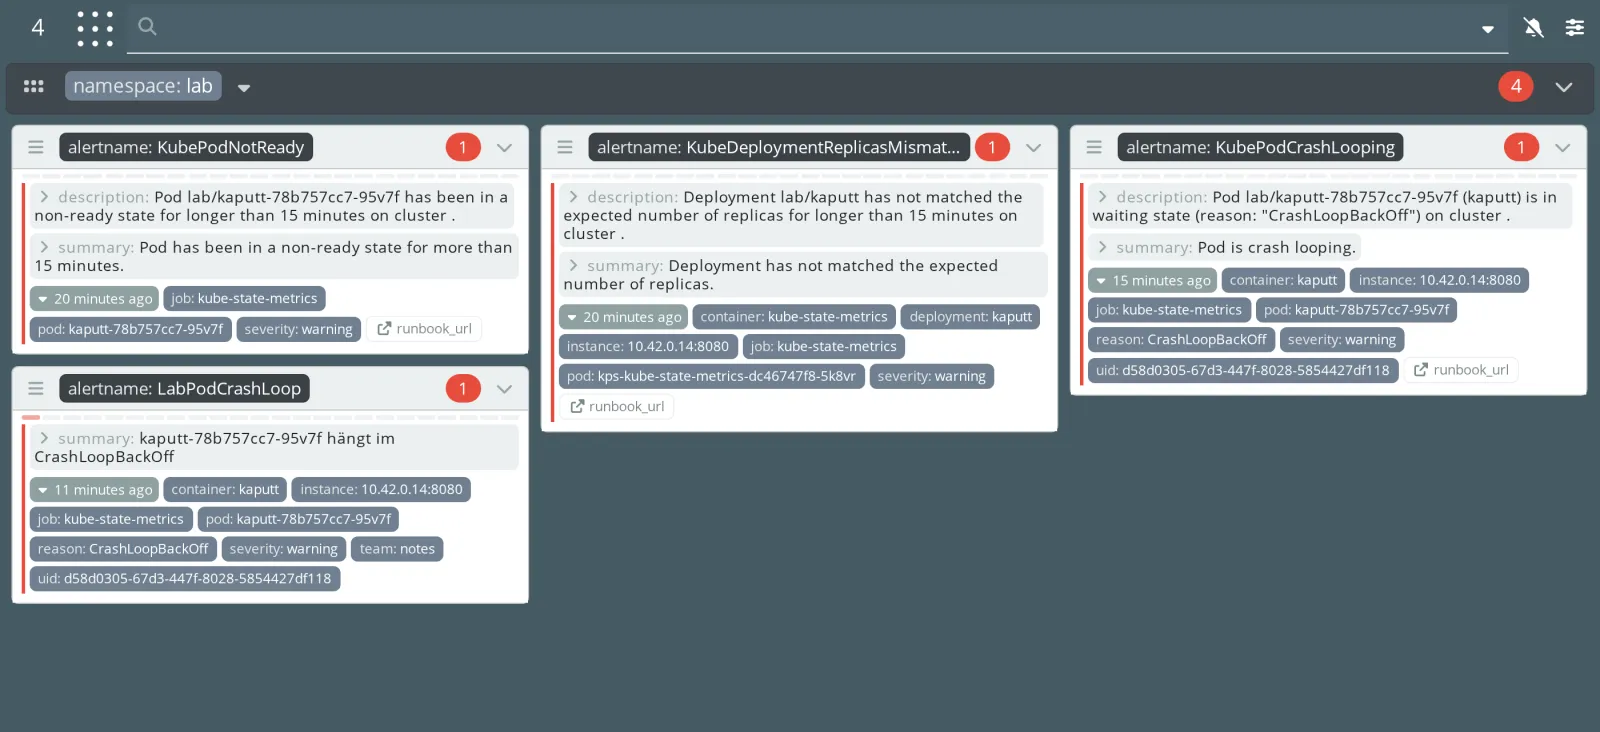
curl -s -G localhost:30800/counters.json --data-urlencode 'q=namespace=lab' | jq .totalExpected after about 15 minutes: 4. Besides your rule,
three kps rules report the broken pod. They have for: 15m
and therefore come later.
Challenge
Apart from the alerts from lab, karma shows
KubeProxyDown, KubeSchedulerDown and
KubeControllerManagerDown, all critical. But
the cluster is running. Find out why, and clear away the false
alerts.
Note: k3s does not start the scheduler, controller
manager and proxy as separate pods but in one process. kps looks for
them as separate scrape targets. The chart has an enabled
switch for each of these components.
Solution
cat >> kps-values.yaml <<'EOF'
kubeProxy:
enabled: false
kubeScheduler:
enabled: false
kubeControllerManager:
enabled: false
kubeEtcd:
enabled: false
EOF
helm upgrade kps prometheus-community/kube-prometheus-stack \
  --version 93.3.0 -n monitoring -f kps-values.yaml --wait
After two minutes:
curl -s localhost:30800/counters.json \
  | jq -c '[.counters[] | select(.name=="alertname") | .values[] | .value]'
Expected:
["KubeDeploymentReplicasMismatch","KubePodCrashLooping","KubePodNotReady","LabPodCrashLoop"]Only alerts from lab remain. With
enabled: false, the chart removes the scrape target and the
rules of the component. You switch off kubeEtcd at the same
time: with a single node, k3s uses SQLite instead of etcd.
Save your progress? Sign up for free
Enterprise Note
- Never publish karma in the cluster via NodePort without protection. Put an ingress with SSO in front (Day 11), plus a NetworkPolicy that only lets the ingress controller through to karma.
- For multiple clusters, karma runs once centrally and reads the Alertmanagers of all clusters. The Alertmanagers then need a reachable endpoint with TLS.
- Set
group_byin the chart deliberately. The default grouping bynamespacecondenses heavily, and you then see too little in karma. - Put rules for your own software as a
PrometheusRulenext to the Deployment, in the same Git repo, with the same reviews.