Day 4: Observe
Goal: You read the success rate, throughput and latency of every service, see individual requests live, and have the Linkerd metrics in Prometheus and Grafana. · Duration: approx. 75 min · Prerequisite: Day 3
Briefing
- Every proxy measures the golden metrics: success rate, requests per second, latency. It serves them on its admin port 4191 in Prometheus format.
- linkerd-viz is the extension that turns them into
stat,top,tap,edgesand a dashboard.tapandtopquery the proxies live, everything else queries Prometheus. - By default, viz ships its own Prometheus – without persistence, for tests only. Instead, you use kube-prometheus-stack, which you need for the cluster anyway.
 Proxies :4191 ─scrape (PodMonitor)──> Prometheus (monitoring) <── Grafana
                                            ^
 linkerd viz stat/edges ──> metrics-api ────┘
 linkerd viz tap/top    ──> tap ──────────> Proxies (live)
Drill 1: Prometheus and Grafana
mkdir -p ~/linkerd/tag04 && cd ~/linkerd/tag04
helm repo add prometheus-community https://prometheus-community.github.io/helm-charts
helm repo update prometheus-community
cat > kps-values.yaml <<'EOF'
alertmanager:
  enabled: false
defaultRules:
  create: false
grafana:
  adminPassword: lab-grafana-123
kubeControllerManager:
  enabled: false
kubeEtcd:
  enabled: false
kubeProxy:
  enabled: false
kubeScheduler:
  enabled: false
nodeExporter:
  enabled: false
prometheus:
  prometheusSpec:
    podMonitorSelectorNilUsesHelmValues: false
    resources:
      limits:
        memory: 1Gi
      requests:
        cpu: 100m
        memory: 256Mi
    retention: 12h
EOF
helm install kps prometheus-community/kube-prometheus-stack --version 93.4.1 \
  -n monitoring --create-namespace -f kps-values.yaml
kubectl -n monitoring rollout status deploy/kps-grafana --timeout=300s
helm -n monitoring list
kubectl -n monitoring get pods
Expected (abridged, may differ by version):
NAME  NAMESPACE   REVISION  ...  STATUS    CHART                         APP VERSION
kps   monitoring  1         ...  deployed  kube-prometheus-stack-93.4.1  v0.95.2
NAME                                                  READY   STATUS    RESTARTS   AGE
kps-grafana-6b448f76b6-rlcz4                          3/3     Running   0          2m
kps-kube-prometheus-stack-operator-597c48dc56-fxlpr   1/1     Running   0          2m
kps-kube-state-metrics-dc46747f8-tgb67                1/1     Running   0          2m
prometheus-kps-kube-prometheus-stack-prometheus-0     2/2     Running   0          2m
The values are trimmed down for a small lab: no Alertmanager, no
node-exporter, 12 hours of retention. What matters is
podMonitorSelectorNilUsesHelmValues: false. Without this
line, Prometheus only honors PodMonitors with the label
release: kps – yours for Linkerd would be ignored.
Tip: If kube-prometheus-stack is already running for you, you install nothing new. Just check with
kubectl get prometheus -A -o yaml | grep -A2 podMonitorSelectorwhether the selector is empty ({}) – otherwise your PodMonitor in Drill 3 gets the matching label.
Save your progress? Sign up for free
Drill 2: Install linkerd-viz
Without its own Prometheus, the CLI refuses until you give it one:
linkerd viz install --set prometheus.enabled=false > /dev/nullExpected (abridged):
Error: execution error at (linkerd-viz/templates/metrics-api.yaml:92:11): Please
enable `linkerd-prometheus` or provide `prometheusUrl` for the viz extension to
function properly
So with an address – and with Grafana right away, so that the dashboard links to it:
P=http://kps-kube-prometheus-stack-prometheus.monitoring.svc.cluster.local:9090
linkerd viz install --set prometheus.enabled=false --set prometheusUrl=$P \
  --set grafana.url=kps-grafana.monitoring.svc.cluster.local > viz.yaml
grep -c '^kind: CustomResourceDefinition' viz.yaml
kubectl apply -f viz.yaml
kubectl -n linkerd-viz rollout status deploy --timeout=300s
linkerd viz check
Expected (abridged):
0
namespace/linkerd-viz created
...
deployment "metrics-api" successfully rolled out
deployment "tap" successfully rolled out
deployment "tap-injector" successfully rolled out
deployment "web" successfully rolled out
...
√ viz extension proxies are healthy
√ viz extension self-check

Status check results are √
viz has no CRDs of its own, but it uses the policy CRDs from Day 1
(Server, AuthorizationPolicy). That is why it
always comes after the Control Plane, and
linkerd viz install requires it to be running.
Why no viz Prometheus? A second Prometheus costs several hundred MiB
on the small workers, has no persistence, and would be a second source
of truth next to the monitoring you run for alerts anyway. The Linkerd
docs recommend exactly this for production (“Bringing your own
Prometheus”). The price: viz now depends on monitoring.
Save your progress? Sign up for free
Drill 3: Scrape the proxies
linkerd viz stat -n notes deployExpected:
NAME        MESHED   SUCCESS   RPS   LATENCY_P50   LATENCY_P95   LATENCY_P99   TCP_CONN
helper         2/2         -     -             -             -             -          -
last           1/1         -     -             -             -             -          -
notes-api      2/2         -     -             -             -             -          -
web            2/2         -     -             -             -             -          -
Empty – Prometheus does not know about the proxies yet. The
PodMonitor below matches the one that Linkerd’s Helm chart creates with
podMonitor.enabled=true. The relabelings turn Pod labels
such as linkerd.io/proxy-deployment into the labels
deployment, namespace and pod
that viz queries:
cat > podmonitor-proxy.yaml <<'EOF'
apiVersion: monitoring.coreos.com/v1
kind: PodMonitor
metadata: {name: linkerd-proxy, namespace: monitoring}
spec:
  namespaceSelector: {any: true}
  selector: {}
  podMetricsEndpoints:
  - interval: 10s
    scrapeTimeout: 10s
    relabelings:
    - sourceLabels: [__meta_kubernetes_pod_container_name,
        __meta_kubernetes_pod_container_port_name,
        __meta_kubernetes_pod_label_linkerd_io_control_plane_ns]
      action: keep
      regex: ^linkerd-proxy;linkerd-admin;linkerd$
    - sourceLabels: [__meta_kubernetes_namespace]
      targetLabel: namespace
    - sourceLabels: [__meta_kubernetes_pod_name]
      targetLabel: pod
    - sourceLabels: [__meta_kubernetes_pod_label_linkerd_io_proxy_job]
      targetLabel: k8s_job
    - action: labeldrop
      regex: __meta_kubernetes_pod_label_linkerd_io_proxy_job
    - action: labelmap
      regex: __meta_kubernetes_pod_label_linkerd_io_proxy_(.+)
    - action: labeldrop
      regex: __meta_kubernetes_pod_label_linkerd_io_proxy_(.+)
    - action: labelmap
      regex: __meta_kubernetes_pod_label_linkerd_io_(.+)
    - action: labelmap
      regex: __meta_kubernetes_pod_label_(.+)
      replacement: __tmp_pod_label_$1
    - action: labelmap
      regex: __tmp_pod_label_linkerd_io_(.+)
      replacement: __tmp_pod_label_$1
    - action: labeldrop
      regex: __tmp_pod_label_linkerd_io_(.+)
    - action: labelmap
      regex: __tmp_pod_label_(.+)
EOF
kubectl apply -f podmonitor-proxy.yaml
sleep 90
linkerd viz stat -n notes deploy
Expected (abridged, numbers vary):
NAME        MESHED   SUCCESS      RPS   LATENCY_P50   LATENCY_P95   LATENCY_P99
helper         2/2    85.19%   1.4rps           1ms           5ms           9ms
last           1/1   100.00%   0.2rps           1ms           9ms          10ms
notes-api      2/2   100.00%   2.0rps           4ms          24ms          29ms
web            2/2    91.47%   2.1rps          10ms          37ms          85ms
Warning: The route via
linkerd upgrade --set podMonitor.enabled=truecreates the PodMonitors as well. With the CLI, however,upgradegenerates new webhook certificates every time and thus restarts the Control Plane – check this withkubectl diffbefore you apply it.
Save your progress? Sign up for free
Drill 4: Golden metrics against the baseline
On Day 0, /flaky was at around 70 percent. But
stat shows 85 percent for helper. Who else is
being counted?
linkerd viz stat -n notes deploy/helper --from deploy/web
linkerd viz stat -n notes po -l app=helper
Expected (numbers vary):
NAME     MESHED   SUCCESS      RPS   LATENCY_P50   LATENCY_P95   LATENCY_P99   TCP_CONN
helper      2/2    70.45%   0.7rps           4ms           9ms          10ms          2
NAME                       STATUS   MESHED   SUCCESS      RPS   LATENCY_P50   ...
helper-76b4db44b6-2xlc5   Running      1/1    85.96%   0.9rps           1ms   ...
helper-76b4db44b6-g7g5s   Running      1/1    85.37%   0.7rps           1ms   ...
With --from deploy/web, only the real traffic counts: 70
percent, exactly the baseline. Without a filter, the readiness probes
(/status/200, always successful) are included. For
web it is 91 percent: two of the load generator’s three
paths always succeed. And last, which nobody calls? Its 0.2
rps land on the proxy’s admin port 4191: kubelet probes for the proxy
itself and Prometheus scrapes. tap does not show them,
linkerd viz authz -n notes deploy/last lists them.
stat calculates over a window of one minute. Right after
a change, you therefore see a mixed value – always wait one minute
before you measure.
Save your progress? Sign up for free
Drill 5: tap and top
linkerd viz tap -n notes deploy/helper --path /unstableExpected (abridged):
Error: no pods to tap for type="deployment" name="helper"
2 pods found with tap not enabled:
        * helper-76b4db44b6-g7g5s
        * helper-76b4db44b6-2xlc5
restart these pods to enable tap and make them valid tap targets
tap needs a permission in the proxy, which viz’s
tap-injector sets when the Pod is created. Pods from before
the viz installation do not have it:
kubectl -n notes rollout restart deploy
kubectl -n notes rollout restart statefulset
kubectl -n notes rollout status deploy/helper --timeout=180s
kubectl -n notes rollout status statefulset/postgres --timeout=180s
kubectl -n notes get pod -l app=web \
  -o jsonpath='{.items[0].metadata.annotations}' | tr ',' '\n' | grep tap
Expected:
"viz.linkerd.io/tap-enabled":"true"}Now live, stop with Ctrl+C:
linkerd viz tap -n notes deploy/helper --path /unstableExpected (abridged):
req id=0:0 proxy=in  src=10.0.2.151:38904 dst=10.0.1.174:8080 tls=true :method=GET ...
rsp id=0:0 proxy=in  src=10.0.2.151:38904 dst=10.0.1.174:8080 tls=true :status=200 ...
end id=0:0 proxy=in  src=10.0.2.151:38904 dst=10.0.1.174:8080 tls=true duration=64µs...
req id=0:0 proxy=in  src=10.0.2.151:60846 dst=10.0.2.1:8080 tls=true :method=GET ...
rsp id=0:0 proxy=in  src=10.0.2.151:60846 dst=10.0.2.1:8080 tls=true :status=500 ...
With -o json, every request shows up with identity and
policy:
linkerd viz tap -n notes deploy/helper --path /unstable -o json | head -40Expected (abridged):
  "source": {
    "metadata": {
      "client_id": "web.notes.serviceaccount.identity.linkerd.cluster.local",
      "deployment": "web",
...
  "destination": {
    "metadata": {
      "authz_name": "all-unauthenticated",
top aggregates tap per path, full screen
(quit with q):
linkerd viz top -n notes deploy/webExpected (abridged):
Source                 Destination                 Method  Path        Count  Success
last-85679cb995-8tn79  web-7bcd4fd8c6-wq5ds        GET     /api/notes     22  100.00%
web-7bcd4fd8c6-wq5ds   notes-api-694dbcff4c-rjmjd  GET     /notes         17  100.00%
last-85679cb995-8tn79  web-7bcd4fd8c6-wq5ds        GET     /flaky         11   63.64%
web-7bcd4fd8c6-wq5ds   helper-6c56c89878-fzp87     GET     /unstable      10   70.00%
Warning:
tapshows paths and header metadata live. Who may usetapis governed by the ClusterRolelinkerd-linkerd-viz-tap-admin– grant it like read access to logs.
Save your progress? Sign up for free
Drill 6: edges and routes
linkerd viz edges -n notes deploy
linkerd viz edges -n notes po | grep postgres
linkerd viz routes -n notes deploy/web
Expected (abridged):
SRC    DST         SRC_NS   DST_NS   SECURED
last   web         notes    notes    √
web    helper      notes    notes    √
web    notes-api   notes    notes    √
notes-api-694dbcff4c-cqc6p   postgres-0   notes    notes    √
notes-api-694dbcff4c-rjmjd   postgres-0   notes    notes    √
ROUTE       SERVICE   SUCCESS   RPS   LATENCY_P50   LATENCY_P95   LATENCY_P99
[DEFAULT]       web         -     -             -             -             -
edges is the quick proof from Day 3: every edge with
√ is mTLS. Postgres is missing for deploy
because it is a StatefulSet – at Pod level it is there.
routes stays empty as long as there is no ServiceProfile.
You measure HTTPRoutes on Day 7 with
linkerd viz stat-outbound.
Save your progress? Sign up for free
Drill 7: The dashboard
linkerd viz dashboard --show url &
sleep 5
curl -s localhost:50750 | grep -o '<title>.*</title>'
Expected:
Linkerd dashboard available at:
http://localhost:50750
Grafana dashboard available at:
http://localhost:50750/grafana
<title>Linkerd</title>
But the browser sits on your laptop. --address 0.0.0.0
does not help:
kill %1
linkerd viz dashboard --address 0.0.0.0 --show url &
sleep 5
curl -s http://$(hostname -I | awk '{print $1}'):50750/ | head -2
kill %1
Expected:
It appears that you are trying to reach this service with a host of '172.16.0.126:5…
This does not match /^(localhost|127\.0\.0\.1|web\.linkerd-viz\.svc\.cluster\.local|...
The viz dashboard only accepts localhost as the host, as
protection against DNS rebinding. Use an SSH tunnel from your laptop and
start the dashboard on cp1 without
--address:
ssh -L 50750:localhost:50750 [email protected] linkerd viz dashboard --show urlThen you open http://localhost:50750 on your laptop and
click into the namespace notes. There you see the same
numbers as with stat and a graph of the edges.
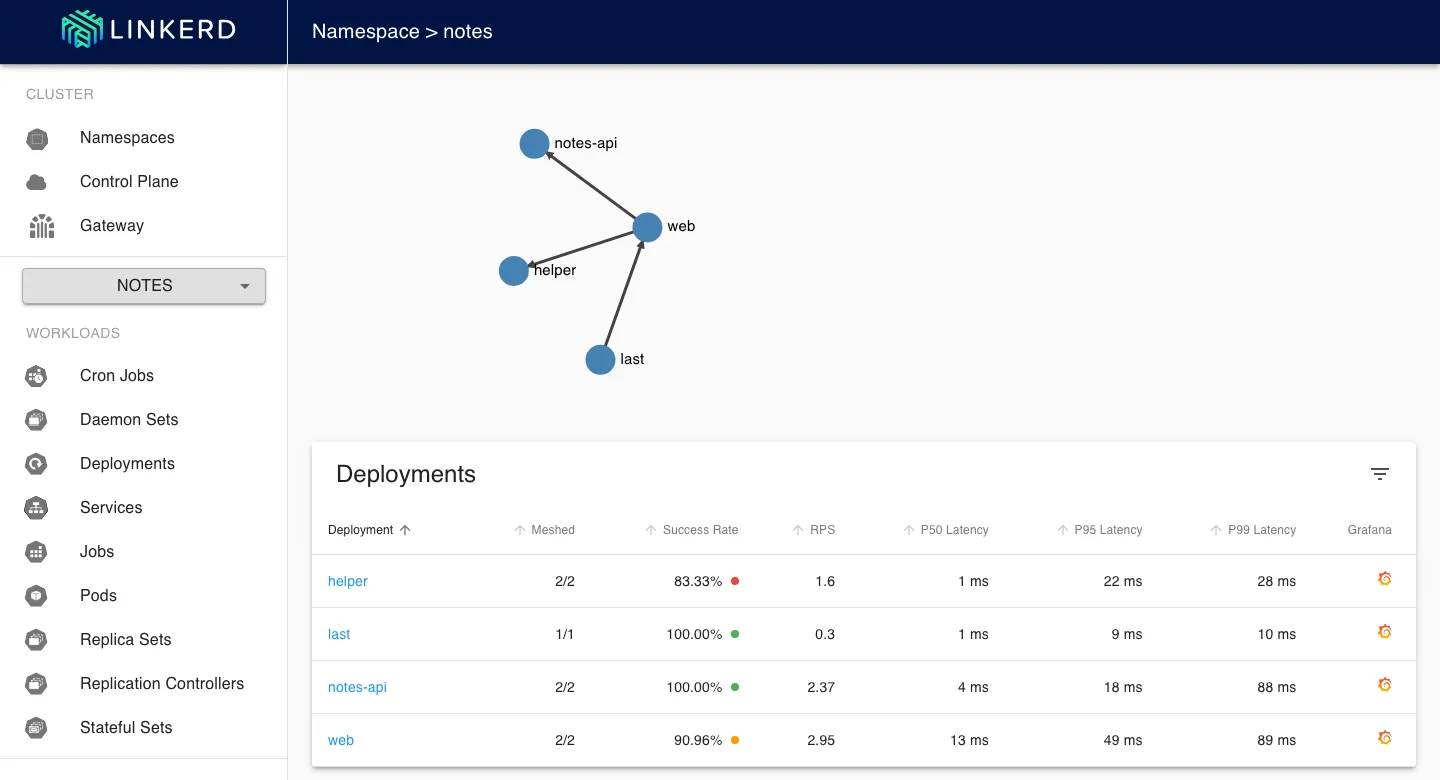
helper and web show red below 100 percent –
that is the deliberately flaky /flaky endpoint from Day 0,
not a fault of the mesh.
Save your progress? Sign up for free
Drill 8: Grafana and PromQL
Linkerd publishes its Grafana dashboards on grafana.com. The Grafana
from kube-prometheus-stack loads every ConfigMap with the label
grafana_dashboard=1:
curl -fsSL -o linkerd-deployment.json \
  https://grafana.com/api/dashboards/15475/revisions/7/download
kubectl -n monitoring create configmap linkerd-deployment-dashboard \
  --from-file=linkerd-deployment.json
kubectl -n monitoring label configmap linkerd-deployment-dashboard grafana_dashboard=1
kubectl -n monitoring port-forward svc/kps-grafana 3000:80 >/dev/null 2>&1 &
sleep 20
curl -s -u admin:lab-grafana-123 'http://localhost:3000/api/search?query=Linkerd' \
  | jq -r '.[] | .title + " " + .uid'
kill %1
Expected:
configmap/linkerd-deployment-dashboard created
configmap/linkerd-deployment-dashboard labeled
Linkerd Deployment linkerd-deployment
Revision 7 is pinned; the dashboard “Linkerd Deployment” selects the
data source via a variable and therefore runs without changes. Through
an SSH tunnel on port 3000, you open it in the browser and select
notes and helper:
ssh -L 3000:localhost:3000 [email protected] \
  kubectl -n monitoring port-forward svc/kps-grafana 3000:80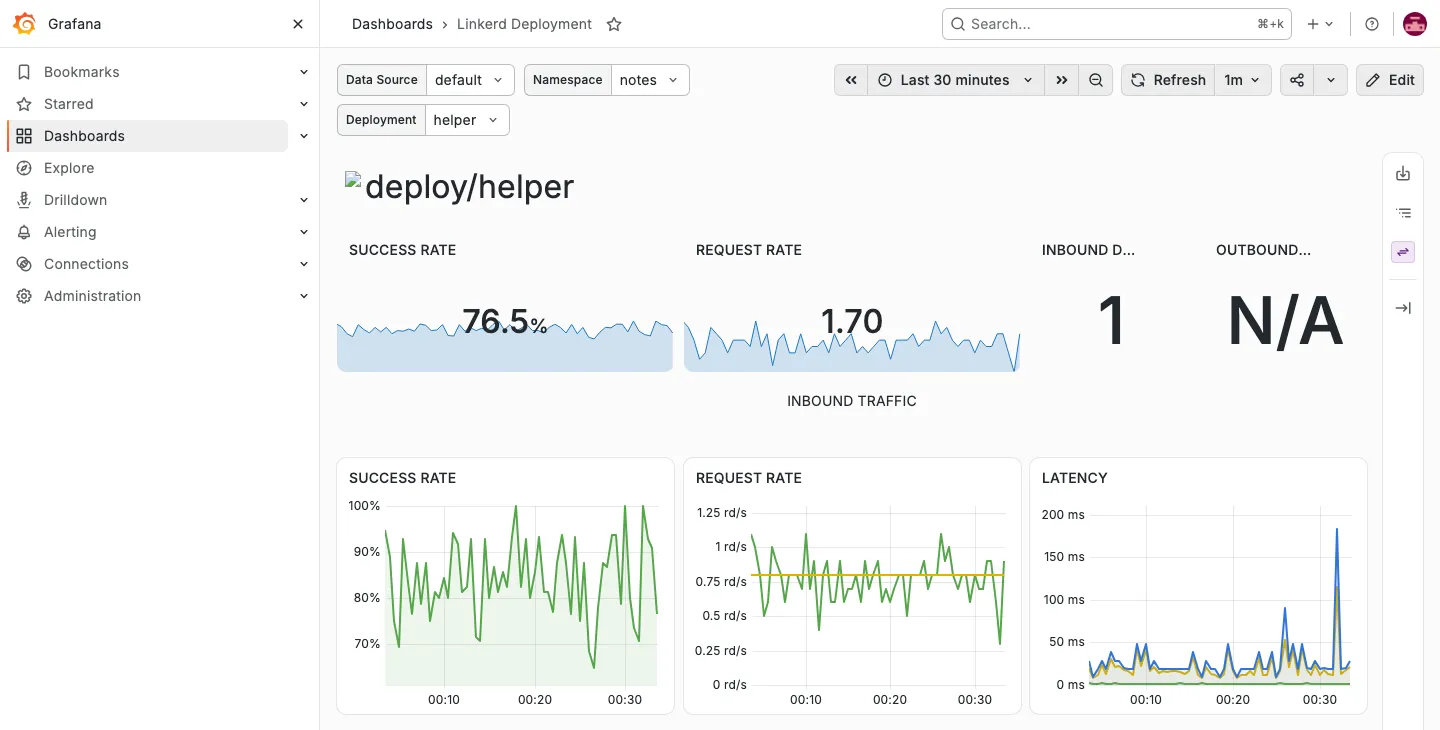
What the dashboard calculates, you can also query directly – the
success rate of web to its destinations over five
minutes:
kubectl -n monitoring port-forward svc/kps-kube-prometheus-stack-prometheus 9090 \
  >/dev/null 2>&1 &
sleep 4
Q='sum by (dst_deployment) (rate(response_total{namespace="notes",
 deployment="web", direction="outbound", classification="success"}[5m]))
 / sum by (dst_deployment) (rate(response_total{namespace="notes",
 deployment="web", direction="outbound"}[5m]))'
curl -s localhost:9090/api/v1/query --data-urlencode "query=$Q" \
  | jq -r '.data.result[] | .metric.dst_deployment + " " + .value[1]'
Expected (numbers vary):
helper 0.7014017344210016
notes-api 0.9180109294522756
helper is at 70 percent, as on Day 0.
notes-api is below 100 percent because the five-minute
window contains the restart from Drill 5: while postgres-0
was restarting, notes-api answered with 500. The mesh makes
such short outages visible, which easily get lost in the load
generator’s log. Repeat the query after five minutes: then it shows
1. You will need the port-forward again shortly.
The same query also works in Grafana under Explore (data source Prometheus, mode Code). There you see the trend instead of a snapshot:
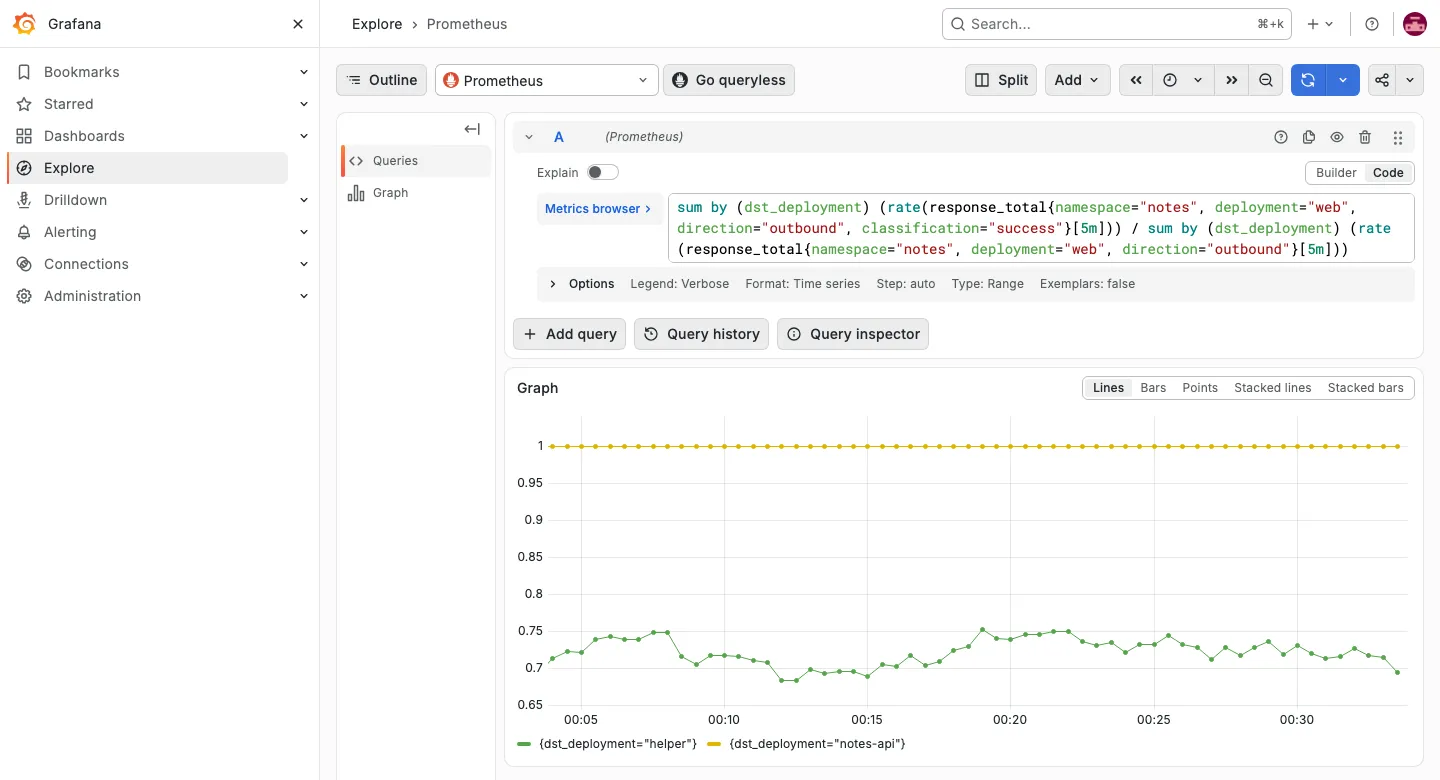
Save your progress? Sign up for free
Exercise: Speed Drills
- Show the success rate of
notes-apifrom the point of view ofweb. Target time: 20 s - Show the next five requests that end on
notes-apiwith status 200 – withtapand the matching filter. Target time: 45 s - Show all mTLS edges in the namespace
linkerd-viz. Target time: 15 s - Count with PromQL how many proxies Prometheus scrapes per namespace. Target time: 60 s
Solution
linkerd viz stat -n notes deploy/notes-api --from deploy/web
linkerd viz tap -n notes deploy/notes-api --path /notes | grep -m5 ':status=200'
linkerd viz edges -n linkerd-viz deploy
curl -s localhost:9090/api/v1/query --data-urlencode \
  'query=count(up{job="monitoring/linkerd-proxy"} == 1) by (namespace)' \
  | jq -r '.data.result[] | .metric.namespace + " " + .value[1]'
Expected (excerpt for 3 and 4):
SRC   DST         SRC_NS        DST_NS   SECURED
tap   notes-api   linkerd-viz   notes    √
linkerd-viz 4
linkerd 3
notes 8
Save your progress? Sign up for free
Checkpoint
linkerd viz check 2>&1 | tail -1Expected:
Status check results are √linkerd viz stat -n notes deploy/helper --from deploy/webExpected: SUCCESS around 70 percent,
like the baseline from Day 0.
kubectl -n monitoring get podmonitor linkerd-proxy
kubectl -n monitoring get configmap -l grafana_dashboard=1 | grep linkerd
Expected: both resources present.
Challenge
Write a PromQL query that returns the hours until the oldest proxy certificate in the cluster expires. This is your first alert for Day 5.
Hint: You know the metric from Day 3, Drill 2.
Solution
curl -s localhost:9090/api/v1/query --data-urlencode \
  'query=(min(control_identity_cert_expiration_timestamp_seconds) - time()) / 3600' \
  | jq -r '.data.result[0].value[1]'
kill %1
Expected (number varies):
19.64361391663551If the value drops below about six hours, renewal is stuck – as an
alert rule, ... < 6 in a PrometheusRule. Note: this
metric applies to the proxy certificates. It does not
monitor the issuer itself.
Save your progress? Sign up for free
Interview Note
- Which metrics does Linkerd provide without code changes? Success rate, RPS and latency percentiles per service, route and edge, plus TCP connections and mTLS status.
- Why does a service’s success rate differ from what clients
experience? Inbound numbers include all callers, probes too;
--fromor the outbound view shows a single edge. - Does the viz Prometheus belong in production? No – your own Prometheus with persistence, viz only as a frontend.
Enterprise Note
- Per Pod in the mesh, the docs estimate a few MB of Prometheus storage – with thousands of Pods, plan for dedicated scrape intervals and recording rules.
- Recording rules for the success rate per service form the basis for SLOs and burn-rate alerts.
- Never expose the dashboard via port-forward for everyone: behind an
ingress with authentication, or not at all. Restrict
tapvia RBAC. - As soon as policies apply (Day 6), Prometheus must still reach admin port 4191 – otherwise all graphs go empty.