Day 11: Monitoring
Goal: Install rancher-monitoring on werk, have Prometheus scrape the notes metrics and trigger an alert that fires when the api loses its database. · Duration: approx. 75 min · Prerequisite: Day 10
Briefing
- rancher-monitoring is Rancher’s package of Prometheus, Alertmanager, Grafana, node-exporter and kube-state-metrics, driven by the Prometheus Operator.
- What Prometheus scrapes you describe with a ServiceMonitor, alerts with a PrometheusRule. Both are CRDs in the application’s namespace.
- The notes api delivers its own values under
/metrics, among themnotes_db_up. - Monitoring costs memory. For the small lab nodes, Prometheus gets less memory and half a day of history.
 Namespace notes                          Namespace cattle-monitoring-system
 ┌───────────────────────────┐            ┌──────────────────────────────────┐
 │ api  /metrics  ◄──────────┼── 30 s ────┤ Prometheus ── rule ───► Alertmgr  │
 │ ServiceMonitor api        │            │      ▲                            │
 │ PrometheusRule notes      │            │      └──── Grafana (dashboards)   │
 │ NetworkPolicy: allow      │            └──────────────────────────────────┘
 └───────────────────────────┘
Drill 1: rancher-monitoring
Like Longhorn, monitoring comes from rancher-charts,
again two charts. The values shrink Prometheus, Alertmanager and
Grafana:
# tag11/monitoring-values.yaml – state at end of Day 11: monitoring for small lab nodes
prometheus:
  prometheusSpec:
    retention: 12h                 # lab: half a day of history is enough
    resources:
      requests: {cpu: 200m, memory: 400Mi}
      limits: {memory: 1200Mi}
alertmanager:
  alertmanagerSpec:
    resources:
      requests: {cpu: 20m, memory: 32Mi}
      limits: {memory: 128Mi}
grafana:
  resources:
    requests: {cpu: 50m, memory: 100Mi}
    limits: {memory: 300Mi}
source ~/rancher-lab/setup/env.sh
mkdir -p "$LAB/tag11" && cd "$LAB/tag11"
cp "$LAB/code/tag11/"* .
export KUBECONFIG="$LAB/kube/rancher.yaml"
ID=$(kubectl -n fleet-default get clusters.provisioning.cattle.io werk \
-o jsonpath='{.status.clusterName}')
H="Authorization: Bearer $(cat "$LAB/rancher-token")"
API="https://rancher.$RANCHER.sslip.io/k8s/clusters/$ID/v1"
API+="/catalog.cattle.io.clusterrepos/rancher-charts"
VER=110.0.2+up80.9.1-rancher.22
V=$(yq -o=json monitoring-values.yaml)
curl -sk -X POST -H "$H" -H 'Content-Type: application/json' "$API?action=install" \
-d "{\"charts\":[
{\"chartName\":\"rancher-monitoring-crd\",\"version\":\"$VER\",
\"releaseName\":\"rancher-monitoring-crd\",\"values\":{}},
{\"chartName\":\"rancher-monitoring\",\"version\":\"$VER\",
\"releaseName\":\"rancher-monitoring\",\"values\":$V}],
\"namespace\":\"cattle-monitoring-system\",\"wait\":true,\"timeout\":\"900s\"}" \
| jq -c '{operationName}'Expected (abridged, names, IPs and times differ on your machine):
{"operationName":"helm-operation-2wqnv"}After just under five minutes everything is up:
export KUBECONFIG="$LAB/kube/werk.yaml"
kubectl -n cattle-monitoring-system get pods
kubectl top nodes
Expected (abridged):
NAME                                                     READY   STATUS    …
alertmanager-rancher-monitoring-alertmanager-0           2/2     Running   …
prometheus-rancher-monitoring-prometheus-0               3/3     Running   …
rancher-monitoring-grafana-7f66d76978-z86nj              3/3     Running   …
rancher-monitoring-kube-state-metrics-b48c9d6fb-g8smp    1/1     Running   …
rancher-monitoring-operator-76b74f56bb-hwb7r             1/1     Running   …
rancher-monitoring-prometheus-adapter-6db5df9455-jh2tf   1/1     Running   …
rancher-monitoring-prometheus-node-exporter-867rn        1/1     Running   …
…
NAME    CPU(cores)   CPU(%)   MEMORY(bytes)   MEMORY(%)
werk1   2448m        61%      5923Mi          74%
werk2   833m         41%      2026Mi          50%
werk3   857m         42%      1883Mi          47%
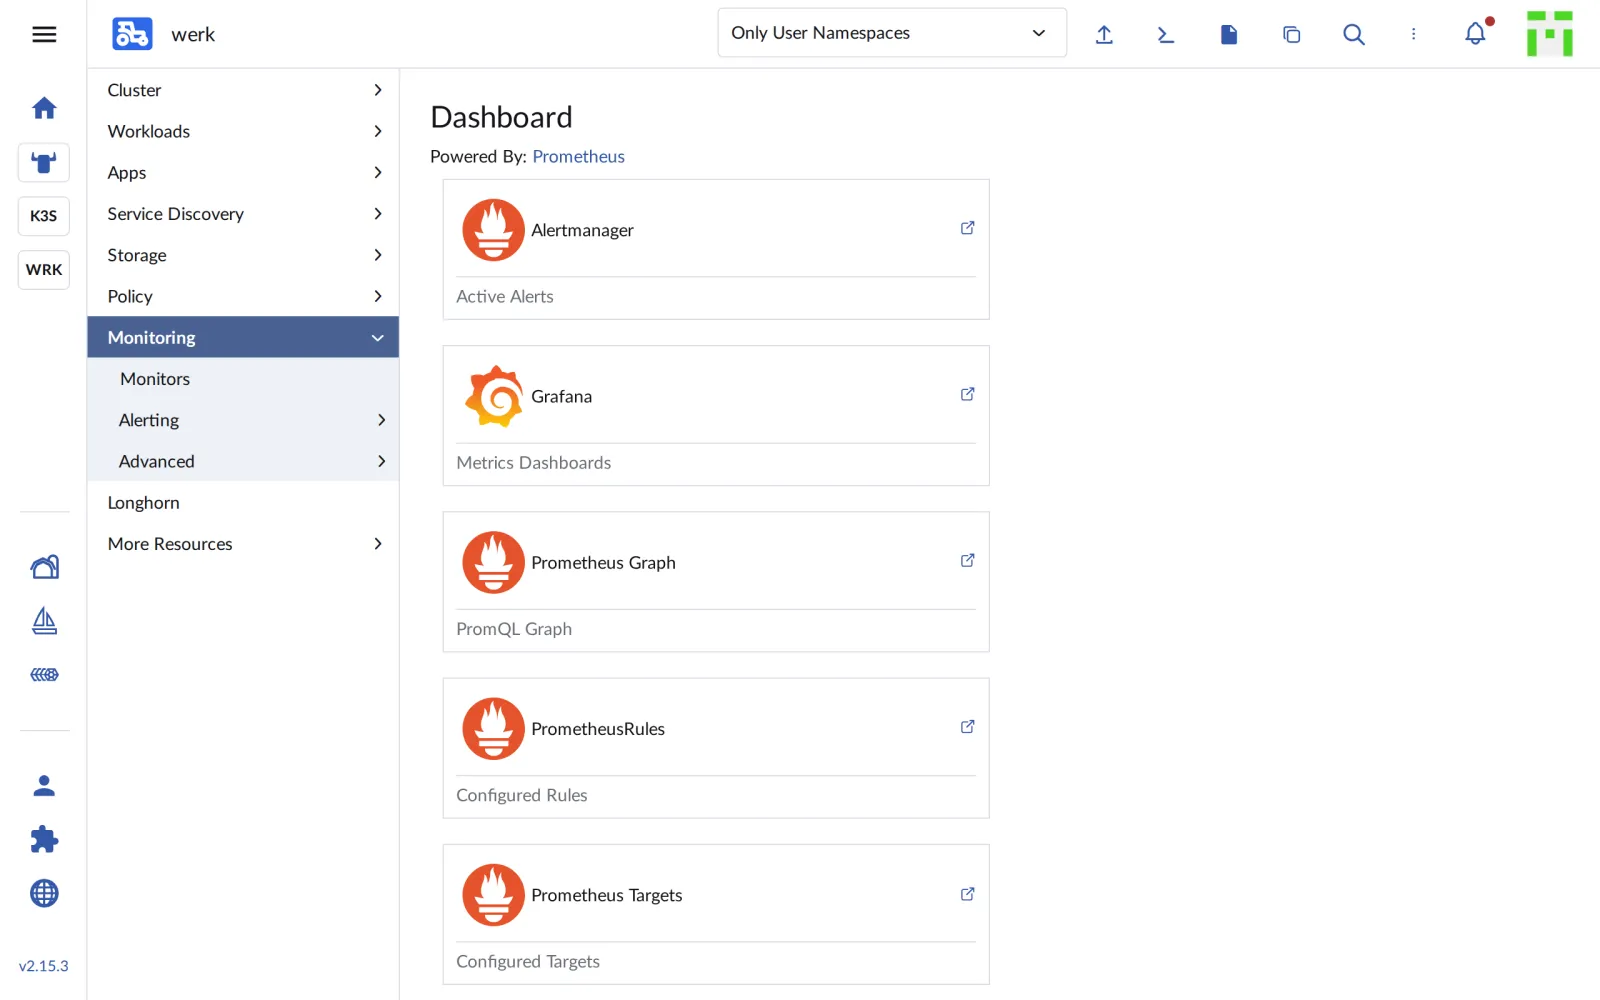
The cluster werk now has the menu item Monitoring with links to all the tools:
Save your progress? Sign up for free
Drill 2: What the api Measures
kubectl -n notes exec deploy/web -- wget -qO- http://api:8080/metrics \
  | grep -E '^notes_'
kubectl -n notes get svc api -o jsonpath='{.spec.ports}'; echo
Expected (abridged):
notes_build_info{store="postgres",version="0.2.0"} 1
notes_http_requests_total{code="200",method="GET",path="/healthz"} 217
notes_http_requests_total{code="200",method="GET",path="/notes"} 54
…
notes_created_total 0
notes_db_up 1
[{"name":"http","port":8080,"protocol":"TCP","targetPort":8080}]
notes_db_up is 1 as long as the api reaches Postgres.
The Service’s port is named http; the ServiceMonitor needs
this name in a moment.
Save your progress? Sign up for free
Drill 3: ServiceMonitor, Network Access, Alert
# tag11/notes-monitoring.yaml – state at end of Day 11: Prometheus watches the api
# 1. Prometheus may reach the api (the chart policies only allow web and worker) …
apiVersion: networking.k8s.io/v1
kind: NetworkPolicy
metadata:
  name: api-from-monitoring
  namespace: notes
spec:
  podSelector:
    matchLabels: {app.kubernetes.io/name: api}
  ingress:
    - from:
        - namespaceSelector:
            matchLabels: {kubernetes.io/metadata.name: cattle-monitoring-system}
      ports:
        - port: 8080
---
# 2. … scrapes /metrics from the api Service every 30 s …
apiVersion: monitoring.coreos.com/v1
kind: ServiceMonitor
metadata:
  name: api
  namespace: notes
spec:
  selector:
    matchLabels: {app.kubernetes.io/name: api}
  endpoints:
    - port: http
      path: /metrics
      interval: 30s
---
# 3. … and raises an alert if the api doesn't answer or the DB is gone.
apiVersion: monitoring.coreos.com/v1
kind: PrometheusRule
metadata:
  name: notes
  namespace: notes
spec:
  groups:
    - name: notes
      rules:
        - alert: NotesApiDown
          expr: up{namespace="notes", job="api"} == 0
          for: 1m
          labels: {severity: critical}
          annotations:
            summary: "notes-api {{ $labels.pod }} antwortet Prometheus nicht"
        - alert: NotesDbDown
          expr: max(notes_db_up{namespace="notes"}) == 0
          for: 1m
          labels: {severity: critical}
          annotations:
            summary: "notes-api erreicht Postgres nicht"
Without part 1, Prometheus wouldn’t reach the api at all: the NetworkPolicies from the chart only let web, worker and the test pod through.
kubectl apply -f notes-monitoring.yamlExpected:
networkpolicy.networking.k8s.io/api-from-monitoring created
servicemonitor.monitoring.coreos.com/api created
prometheusrule.monitoring.coreos.com/notes created
Save your progress? Sign up for free
Drill 4: Ask Prometheus
Prometheus has an HTTP API. Asked from inside the pod, no port forward is needed:
prom() {
  kubectl -n cattle-monitoring-system exec prometheus-rancher-monitoring-prometheus-0 \
    -c prometheus -- wget -qO- "http://localhost:9090/api/v1/$1"
}
q() { prom "query?query=$1"; }
q 'up%7Bnamespace%3D%22notes%22%7D' \
  | jq -r '.data.result[] | "\(.metric.job) \(.metric.pod) \(.value[1])"'
q 'sum%20by%20(code)%20(rate(notes_http_requests_total%5B5m%5D))' \
  | jq -r '.data.result[] | "\(.metric.code) \(.value[1])"'
prom 'rules?type=alert' \
  | jq -r '.data.groups[] | select(.name=="notes") | .rules[] | "\(.name) \(.state)"'
Expected (abridged, at the earliest one minute after Drill 3):
api api-5968bfb5cc-5smz4 1
api api-5968bfb5cc-zzpn8 1
200 0.17483122222222222
503 0
500 0
NotesApiDown inactive
NotesDbDown inactive
The queries are URL-encoded PromQL:
up{namespace="notes"} and the request rate per status code
over the last five minutes. Both api pods are up, the
alerts are quiet.
Warning: If you delete the network policy
api-from-monitoringagain, you’d expectup = 0. In the test,upstayed at 1 for minutes: Prometheus holds an open keep-alive connection, and canal lets existing connections through. Only new connections fail.
Save your progress? Sign up for free
Drill 5: Grafana
The Grafana link on the monitoring page goes through Rancher’s proxy. In the test, Grafana 12.3 showed only “Page not found” there. A port forward goes directly to the Service; Grafana allows access without login, because otherwise Rancher handles the login:
kubectl -n cattle-monitoring-system port-forward \
  svc/rancher-monitoring-grafana 3000:80 &
curl -s http://localhost:3000/api/health | jq -c '{database, version}'
open "http://localhost:3000/d/85a562078cdf77779eaa1add43ccec1e/x?var-namespace=notes"
Expected:
Forwarding from 127.0.0.1:3000 -> 3000
{"database":"ok","version":"12.3.1"}
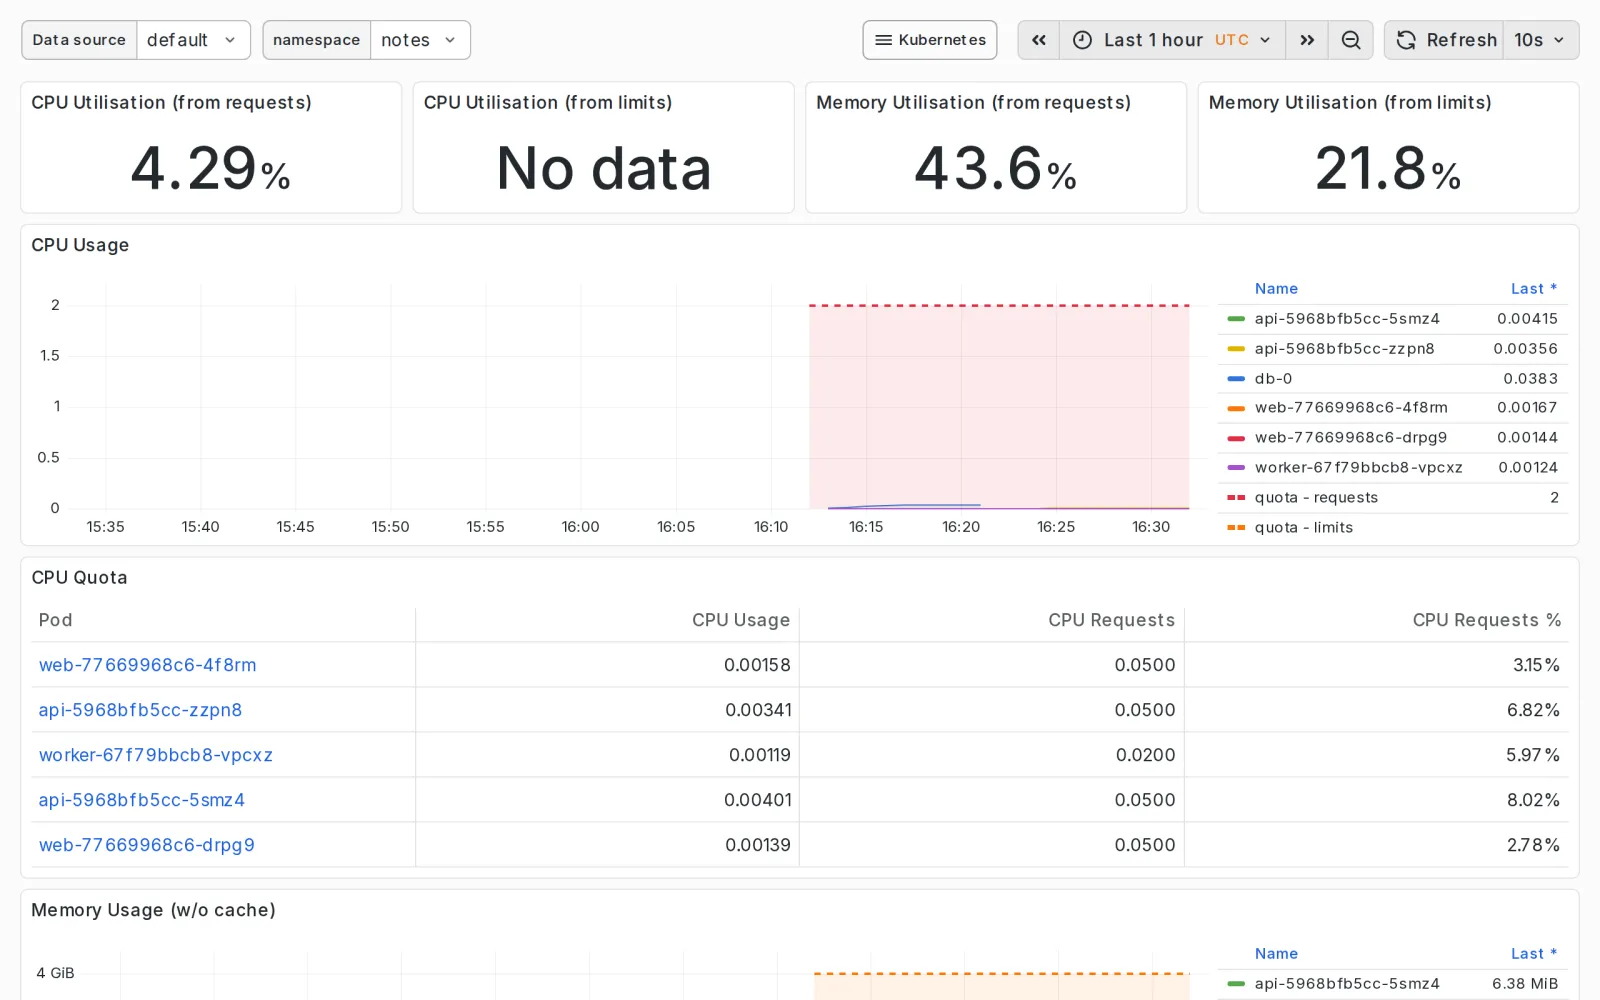
The dashboard Kubernetes / Compute Resources / Namespace (Pods) shows CPU, memory and quota of notes:
End the tunnel afterwards with kill %1.
Save your progress? Sign up for free
Checkpoint
kubectl -n notes get servicemonitor,prometheusruleExpected: ServiceMonitor api and rule
notes.
NAME                                       AGE
servicemonitor.monitoring.coreos.com/api   21m

NAME                                         AGE
prometheusrule.monitoring.coreos.com/notes   21m
q 'up%7Bnamespace%3D%22notes%22%7D' | jq -r '.data.result[] | .value[1]'Expected: 1 twice, one value per api pod.
1
1
helm -n cattle-monitoring-system listExpected: both charts deployed.
NAME                     NAMESPACE                  …   STATUS     CHART
rancher-monitoring       cattle-monitoring-system   …   deployed   rancher-monitoring…
rancher-monitoring-crd   cattle-monitoring-system   …   deployed   rancher-monitoring…
Challenge
Make the alert NotesDbDown fire without touching the
api, and look at it in Prometheus. Then restore the normal state. Keep
in mind who switched on drift correction on Day 8.
Hint: Fleet reverts manual changes as long as the GitRepo isn’t paused.
Solution
kubectl --kubeconfig "$LAB/kube/rancher.yaml" -n fleet-default \
  patch gitrepos.fleet.cattle.io notes --type merge -p '{"spec":{"paused":true}}'
kubectl -n notes scale statefulset db --replicas=0
prom alerts \
  | jq -r '.data.alerts[] | select(.labels.alertname=="NotesDbDown")
           | "\(.labels.alertname) \(.state) \(.annotations.summary)"'
kubectl --kubeconfig "$LAB/kube/rancher.yaml" -n fleet-default \
  patch gitrepos.fleet.cattle.io notes --type merge -p '{"spec":{"paused":false}}'
kubectl -n notes wait --for=condition=Ready pod/db-0 --timeout=300s
Expected (abridged; for the query, wait two minutes after the
scale):
gitrepo.fleet.cattle.io/notes patched
statefulset.apps/db scaled
NotesDbDown firing notes-api erreicht Postgres nicht
gitrepo.fleet.cattle.io/notes patched
pod/db-0 condition met
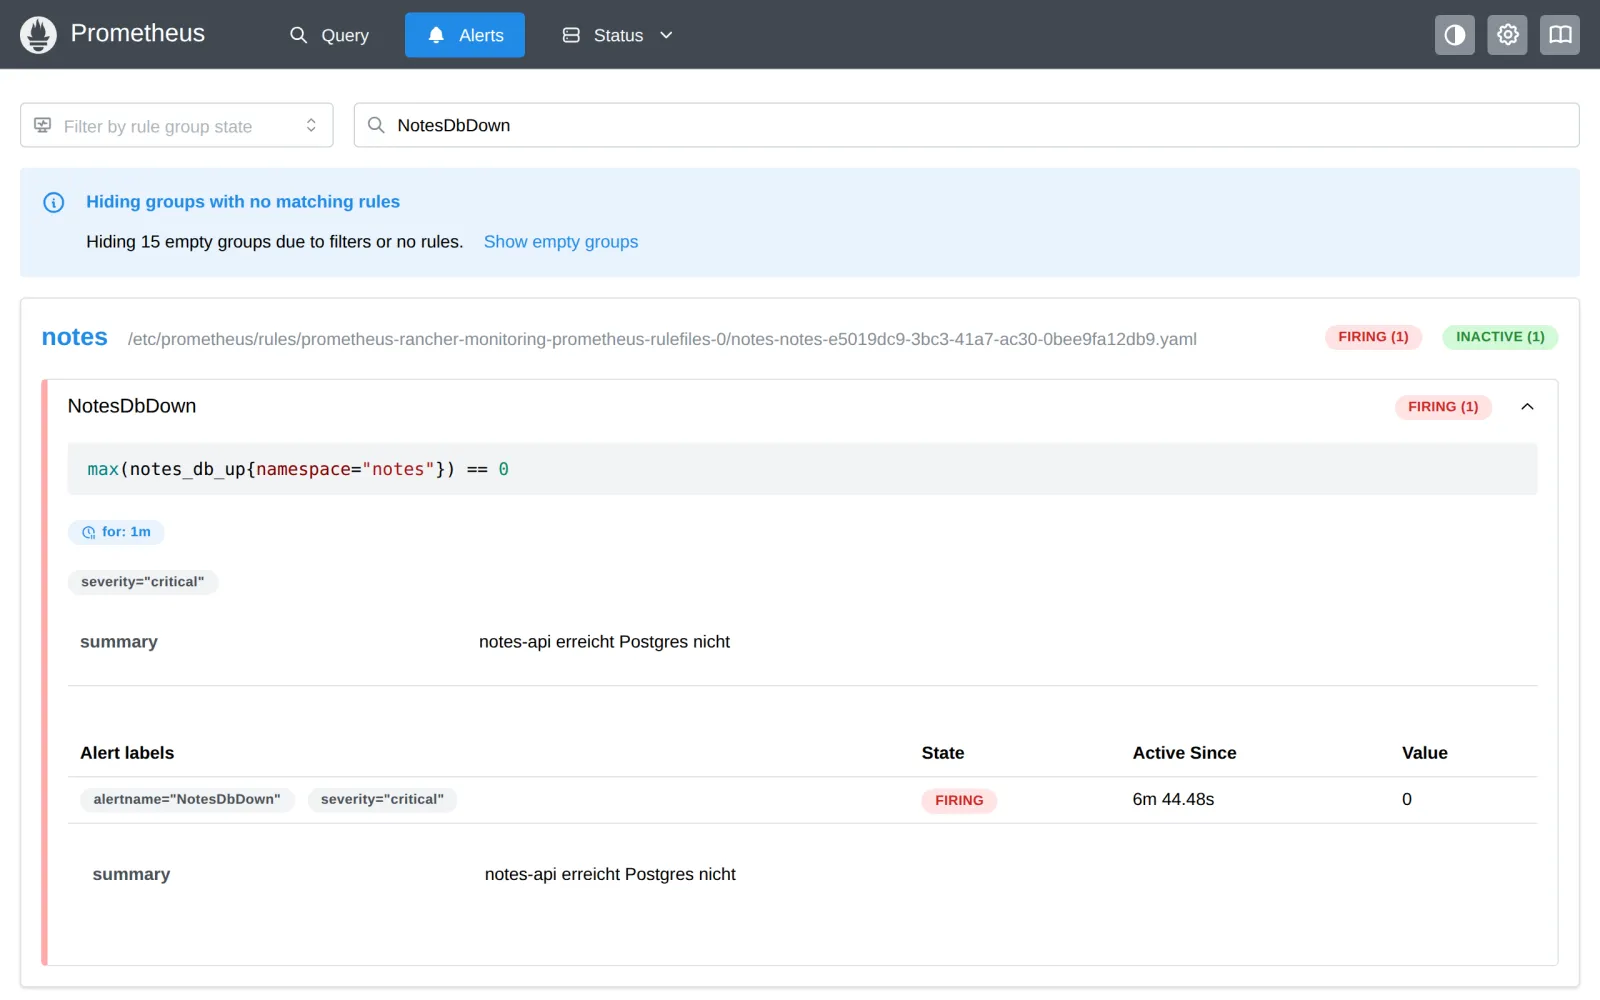
After about 50 seconds the alert is pending, after the
minute from for: 1m it is firing. In the
Prometheus UI (link PrometheusRules on the monitoring
page) it looks like this:
As soon as Fleet resumes, drift correction restores the database, and a minute later the alert is gone. Without the pause, Fleet would have sabotaged the test.
Save your progress? Sign up for free
Enterprise Note
- Notifications: Alertmanager sends alerts to email,
Slack, Teams or PagerDuty. In Rancher you configure receivers and routes
as
AlertmanagerConfig. - Long term: Prometheus in the cluster only keeps days. Thanos, Mimir or a monitoring service collect metrics from many clusters centrally and for a long time.
- Logs: rancher-logging (Fluent Bit, Fluentd) sends container logs to Loki, Elasticsearch or Splunk. Metrics tell you that something is stuck, logs tell you why.
- Resources: Monitoring grows with cluster size and number of metrics. Storage and retention belong in planning, not left to chance.
- GitOps: ServiceMonitor, rules and network policy belong in the notes repository and come along via Fleet, just like the chart itself.